Keltner Channel %B
Learn how to use the Keltner Channel %B in Gainium for automated trading strategies, detecting breakouts, and identifying overbought/oversold conditions.
TL;DR
Keltner Channel %B measures where price sits within the Keltner Channel bands (0 = lower band, 0.5 = middle EMA, 1 = upper band), useful for detecting overbought/oversold conditions and breakouts. Use it for mean reversion or breakout strategies.
The Keltner Channel %B (KC%B) is a technical indicator that measures where the price lies within the Keltner Channel's range. This indicator is especially useful for identifying potential overbought and oversold conditions based on price movements relative to the upper, middle, and lower bands of the Keltner Channel. The %B value tells you how close the price is to these bands, helping you make informed decisions about potential breakouts or reversals.
In this article, we will explain the Keltner Channel %B indicator, demonstrate how to configure it in Gainium, and show how to use it in bot trading with strategy examples, including entry and exit rules. We will also cover practical considerations and conclude with best practices for integrating the Keltner Channel %B into your trading strategy.
What Is Keltner Channel %B?#
Keltner Channel %B measures the position of the price relative to the Keltner Channel's upper and lower bands, with a value typically ranging from 0 to 1:
- 0: Price is at or below the lower band.
- 0.5: Price is at the middle line (EMA).
- 1: Price is at or above the upper band.
Key Features:#
- Overbought Condition: If %B approaches or exceeds 1, it suggests that the price is nearing or exceeding the upper band, signaling overbought conditions.
- Oversold Condition: If %B approaches or falls below 0, it indicates the price is nearing or below the lower band, signaling oversold conditions.
How to Configure Keltner Channel %B in Gainium#
Here’s how to set up and configure Keltner Channel %B in Gainium using the settings provided in the image.
Step 1: Add the Keltner Channel %B Indicator#
- Navigate to the Bot Settings:Log into Gainium, select your bot, and find the Keltner Channel %B (KC%B) from the list of available indicators.
Step 2: Configure the Indicator Settings#
- MA Type (EMA): This is the moving average type used for the Keltner Channel's middle line. In this example,** an Exponential Moving Average (EMA)** is chosen, which places more weight on recent price data than a Simple Moving Average (SMA).
- Range Type (ATR): The Average True Range (ATR) is used to calculate the width of the Keltner Channel bands. This helps adjust the bands based on market volatility.
- Range Length (10): The range length determines how far back the ATR is calculated. This example sets it to 10, meaning the ATR is calculated based on the past 10 periods.
- Length (20): This setting defines the length of the EMA, which serves as the middle line of the Keltner Channel. A length of 20 is a common choice for smoothing out price fluctuations.
- Multiplier (2): The multiplier adjusts the width of the upper and lower bands relative to the middle line. In this case, it is set to 2, meaning the bands are placed 2 times the ATR away from the EMA.
- Interval: The interval refers to the time period for each candlestick in the chart. The attached settings set the interval to 1 day, meaning the Keltner Channel %B is calculated based on daily price movements.
- Condition (Crossing Up): The condition defines when the bot will take action. In this case,** Crossing Up** is chosen, meaning the bot will trigger when the %B value crosses up through a specific value (0 in this case).
- Value (0): This value represents the threshold for triggering the condition. The bot will act when the price crosses above the lower band (a %B value of 0).
- Keep True (0): This setting determines how long the condition remains active after it is triggered. A value of 0 means the condition resets immediately after the trigger.
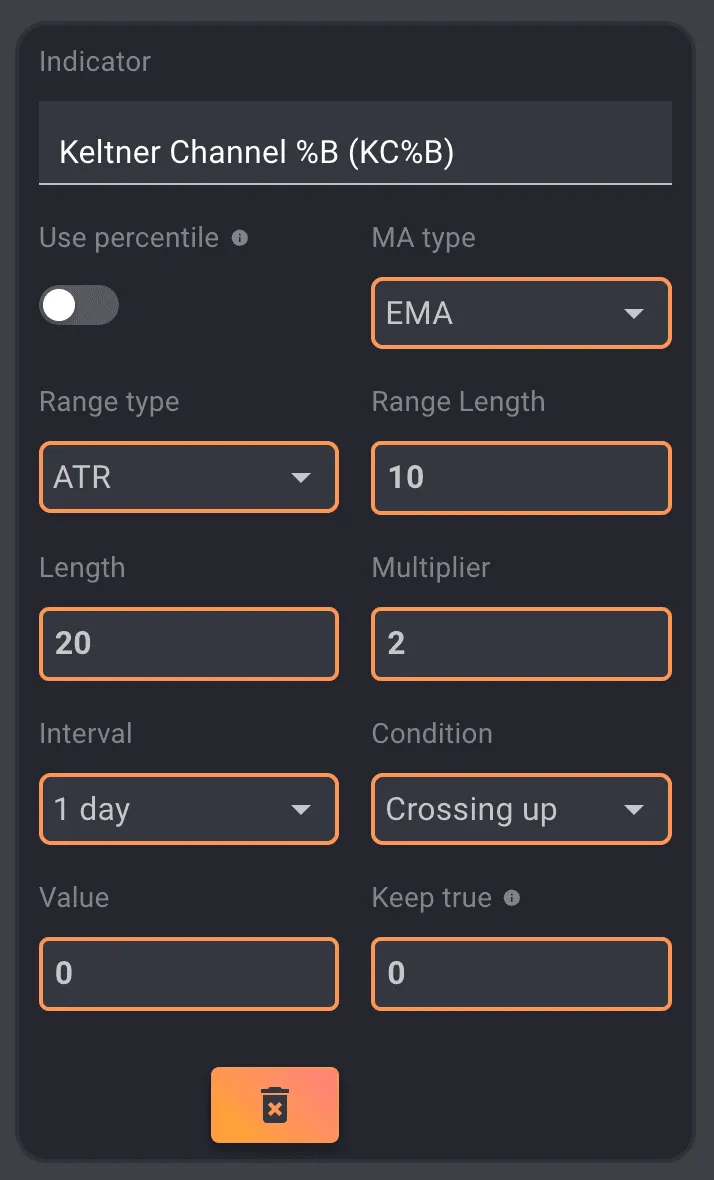 Keltner Channel %B Settings
Using Keltner Channel %B in Bot Trading#
Here are two example trading strategies that incorporate the Keltner Channel %B into automated bot trading.
Strategy 1: Mean Reversion Strategy#
Entry Rules
- Long Entry (Buy):Enter a long position when the %B value crosses up from below 0. This signals that the price is at or below the lower band and a potential upward reversal may occur.
- Short Entry (Sell):Enter a short position when the %B value crosses down from above 1, signaling that the price is at or above the upper band and a potential downward reversal may occur.
Exit Rules
- Long Exit:Exit the trade when the %B value crosses above 0.5, signaling the price is back at the middle of the channel and may be overbought.
- Short Exit:Exit the trade when the %B value crosses below 0.5, signaling the price is back at the middle and could be oversold.
Implementation in Gainium
- Configure the Keltner Channel %B: Set the EMA as the moving average type and ATR as the range type. Use a 10-period ATR and a 20-period EMA with a 2x multiplier. Configure the bot to trigger long entries when %B crosses up from below 0, and short entries when %B crosses down from above 1.
- Automate Entries and Exits: The bot can automatically enter long trades when the %B crosses up from the lower band and short trades when the %B crosses down from the upper band.
Strategy 2: Breakout Trading Strategy#
Entry Rules
- Long Entry (Buy):Enter a long position when the %B value breaks above 1, signaling that the price is breaking out of the upper band and an upward trend may begin.
- Short Entry (Sell):Enter a short position when the %B value breaks below 0, signaling that the price is breaking below the lower band and a downward trend may start.
Exit Rules
- Long Exit:Exit the long trade when the %B crosses back below 1, signaling that the upward momentum is weakening.
- Short Exit:Exit the short trade when the %B crosses back above 0, signaling that the downward momentum is weakening.
Implementation in Gainium
- Set Up Breakout Conditions: Configure the bot to trigger long trades when the %B value breaks above 1 and short trades when it breaks below 0. This helps capture breakout opportunities.
- Risk Management: Use stop-loss orders to protect against false breakouts in volatile market conditions.
Practical Considerations#
Here are some important considerations when using Keltner Channel %B in your trading strategy:
1. Timeframe Adjustments#
- Shorter timeframes (e.g., 1 hour) will generate more frequent signals, while longer timeframes (e.g., 1 day) will help capture major trends. Adjust based on your trading goals.
2. Combine with Other Indicators#
- To increase the reliability of your trades, consider combining the Keltner Channel %B with other indicators such as RSI or Bollinger Bands for additional confirmation of overbought or oversold conditions.
3. Watch for Market Conditions#
- In trending markets, the Keltner Channel %B can help identify breakout points, while it can help spot reversals in ranging markets. However, during low volatility or choppy periods, false signals may occur.
4. Backtesting#
- Always backtest your trading strategies before using them live. Gainium’s backtesting feature can help you refine your settings and determine which parameters work best under different market conditions.
Conclusion#
The Keltner Channel %B is a powerful indicator for identifying overbought and oversold conditions, detecting breakouts, and spotting potential reversals. By configuring it in Gainium and incorporating it into your automated bot trading strategy, you can capitalize on price movements within the Keltner Channel and use the %B value to make more informed trading decisions.
Whether you’re using the Keltner Channel %B for mean reversion or breakout strategies, combining it with other indicators and applying sound risk management practices can help you maximize your trading success.