Keltner Channel
Learn how to use the Keltner Channel in Gainium for automated trading, identifying trend reversals and breakouts, with detailed strategy examples and configurations.
TL;DR
The Keltner Channel is a volatility-based indicator with an EMA centerline and ATR-derived upper/lower bands used to identify overbought/oversold conditions and breakouts. Configure it in Gainium to trigger trades when price crosses the bands.
The Keltner Channel is a volatility-based technical indicator used to identify overbought and oversold levels and detect potential breakouts. It consists of an Exponential Moving Average (EMA) and bands above and below the EMA based on the Average True Range (ATR). The Keltner Channel is often used to determine trend direction and signal potential price reversals or breakouts from the current range.
In this article, we will define the Keltner Channel indicator, explain how to configure it in Gainium, and demonstrate how to use it effectively in automated bot trading. We will also provide examples of trading strategies with detailed entry and exit rules, discuss practical considerations, and conclude with best practices for using the Keltner Channel in your trading strategy.
What Is the Keltner Channel?#
The Keltner Channel is a volatility-based indicator that uses the Exponential Moving Average (EMA) as the centerline. The upper and lower bands are calculated using a multiple of the Average True Range (ATR). These bands help identify overbought or oversold conditions, potential price breakouts, and overall trend direction.
Key Features:#
- Middle Line: The EMA, which tracks the overall trend direction.
- Upper and Lower Bands: Defined by adding/subtracting a multiple of the ATR to/from the EMA, indicating potential overbought and oversold conditions.
- Price Breakout: When price moves above or below the bands, it signals potential trend reversals or breakout opportunities.
How to Configure the Keltner Channel in Gainium#
Here’s how to configure the Keltner Channel in Gainium based on the attached settings.
Step 1: Add the Keltner Channel Indicator#
- Navigate to Bot Settings:Log into Gainium, select your bot, and find the Keltner Channel (KC) in the list of available indicators.
Step 2: Configure the Indicator Settings#
- MA Type (EMA): This setting controls the type of moving average used for the middle line of the Keltner Channel. In this example, the Exponential Moving Average (EMA) is selected, which places more weight on recent price data than a simple moving average (SMA).
- Range Type (ATR): The Average True Range (ATR) calculates the upper and lower bands. ATR measures volatility, and the bands adjust based on changes in market volatility.
- Range Length (10): This setting determines the lookback period for the ATR calculation. This example sets it to 10, meaning the ATR is calculated using the past 10 periods.
- Length (20): This setting determines the length of the EMA used for the middle line of the Keltner Channel. A length of 20 is common for smoothing out price data and identifying the overall trend direction.
- Multiplier (2): The multiplier determines how far the upper and lower bands are placed from the EMA. In this case, it is set to 2, meaning the bands are placed 2 times the ATR away from the EMA.
- Interval: This determines the timeframe used for each candlestick in the calculation. In the provided settings, the interval is set to 1 day, meaning the indicator is calculated based on daily price data.
- Condition (Price Crossing Up): This condition is set to trigger when the price crosses up through the lower band of the Keltner Channel, which could signal a reversal or an opportunity to buy.
- Value (Lower): This setting specifies the band to use for the trigger. Here, the lower band is selected, meaning the bot will act when the price crosses up from below the lower Keltner Channel.
- Keep True (0): This setting defines how long the condition remains true after it’s triggered. Setting this to 0 means the condition resets immediately after being triggered.
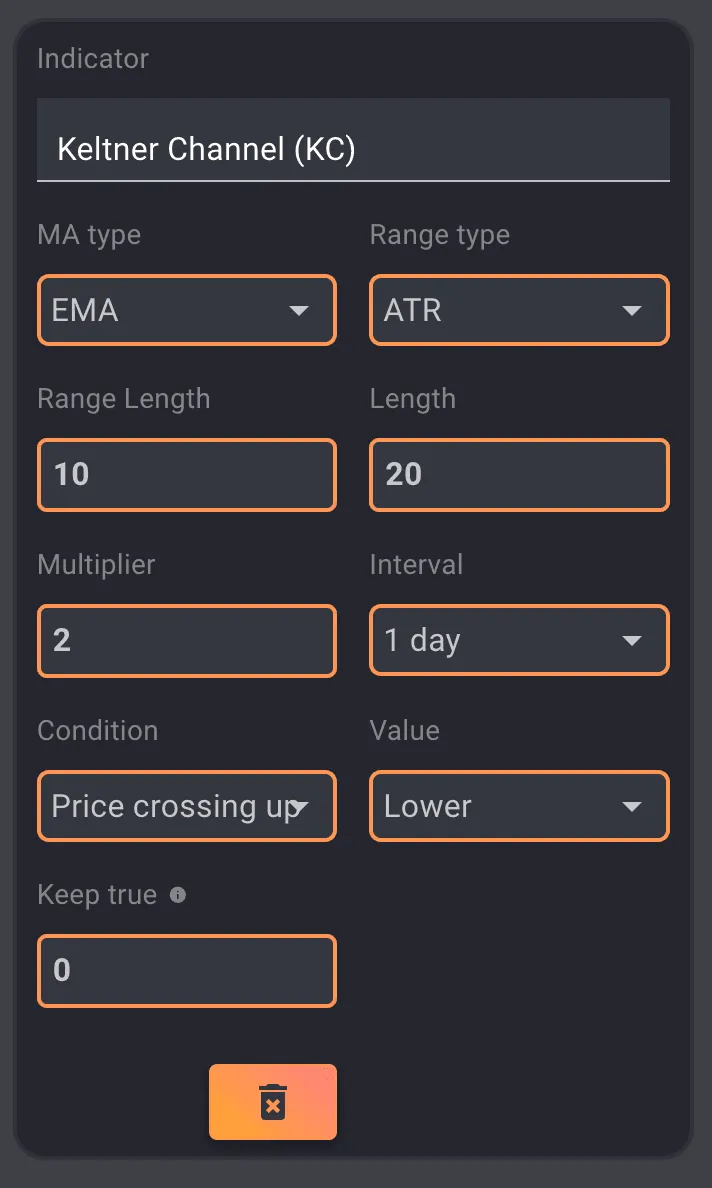 Keltner Channel Settings
Using Keltner Channel in Bot Trading#
Here are two trading strategies that incorporate the Keltner Channel into automated bot trading.
Strategy 1: Reversal Strategy Using Keltner Channel#
Entry Rules
- Long Entry (Buy):Enter a long position when the price crosses up through the lower band of the Keltner Channel, signaling an oversold condition and a potential upward reversal.
- Short Entry (Sell):Enter a short position when the price crosses down through the upper band, indicating an overbought condition and a potential downward reversal.
Exit Rules
- Long Exit:Exit the long trade when the price crosses above the upper band, signaling the upward momentum has reached an overbought condition.
- Short Exit:Exit the short trade when the price crosses below the lower band, signaling that the price has reached an oversold condition.
Implementation in Gainium
- Configure the Keltner Channel: Set the EMA as the moving average type and ATR as the range type. Use the 10-period ATR and 20-period EMA, with a 2x multiplier. Configure the bot to trigger trades when the price crosses up or down through the bands.
- Automate Entries and Exits: The bot can automatically enter long trades when the price crosses up from below the lower band and short trades when the price crosses down from above the upper band.
Strategy 2: Breakout Trading Strategy#
Entry Rules
- Long Entry (Buy):Enter a long position when the price breaks above the upper band, signaling a potential breakout and the beginning of an upward trend.
- Short Entry (Sell):Enter a short position when the price breaks below the lower band, indicating a potential breakout and the start of a downward trend.
Exit Rules
- Long Exit:Exit the trade when the price crosses below the middle line (EMA), signaling the end of the upward trend.
- Short Exit:Exit the trade when the price crosses above the middle line (EMA), signaling the end of the downward trend.
Implementation in Gainium
- Set Up Breakout Conditions: Configure the bot to trigger long entries when the price breaks above the upper band and short entries when the price breaks below the lower band. Set the middle line (EMA) as the exit point.
- Risk Management: Use stop-loss orders to protect against false breakouts, especially in volatile market conditions.
Practical Considerations#
Here are a few practical tips when using the Keltner Channel in your trading strategy:
1. Timeframe Adjustments#
- A 1-day interval provides signals for longer-term trends, while shorter intervals (e.g., 1 hour) provide more frequent signals for day traders. Adjust the interval based on your trading style.
2. Combine with Other Indicators#
- To increase accuracy, combine the Keltner Channel with other indicators, such as RSI or MACD, to confirm signals. This can reduce the risk of false breakouts or reversals.
3. Use with Volatile Markets#
- The Keltner Channel works particularly well in volatile markets because the bands are based on ATR, which expands or contracts based on volatility. However, false signals can occur during periods of consolidation or sideways movement.
4. Backtest Thoroughly#
- Always backtest your Keltner Channel-based strategies using Gainium’s backtesting tools to ensure they perform well under different market conditions. Adjust the period lengths, multipliers, and other settings based on the asset you’re trading.
Conclusion#
The Keltner Channel is a powerful volatility-based indicator that helps traders identify overbought and oversold conditions, detect potential trend reversals, and capture breakouts. By configuring it properly in Gainium, you can automate trading strategies that take advantage of price movements across the upper and lower bands.
Whether you’re using the Keltner Channel to catch reversals or breakouts, combining it with other indicators and backtesting thoroughly can help improve your trading success.