Moving Average Convergence Divergence (MACD)
In this article, we explain what is the Moving Average Convergence Divergence (MACD) indicator and how it can be used in bot trading.
TL;DR
The MACD indicator tracks the relationship between a 12-period and 26-period EMA with a 9-period signal line, generating signals via crossovers, histogram shifts, and divergences. Use it in Gainium bots for trend reversal, continuation, or divergence strategies.
As the cryptocurrency market continues flourishing, so does the interest in trading automation. Trading bots have revolutionized how investors approach digital currencies by minimizing the human factor and reducing the effects of market volatility. One essential tool that can optimize trading bot performance is the Moving Average Convergence Divergence (MACD) indicator. This article will explore how to utilize MACD effectively in your automated trading strategy.
What is the MACD indicator?#
The MACD is a momentum-based technical indicator that tracks the relationship between two moving averages of a digital asset's price. Developed by Gerald Appel in the 1970s, this indicator aims to reveal changes in a trend's strength, direction, and duration. The MACD consists of two components:
a. MACD Line: The difference between a short-term (typically 12-day) and a long-term (usually 26-day) Exponential Moving Average (EMA).b. Signal Line: A 9-day EMA of the MACD Line.
The MACD Line and Signal Line interaction generates trading signals that can help identify potential entry and exit points.
Using the MACD in Gainium#
The MACD indicator is available in your bot settings' “Deal Start” section. Select “Technical Indicators” from the “Deal start condition” drop-down menu first, then “MACD” in the “Indicator” Section.
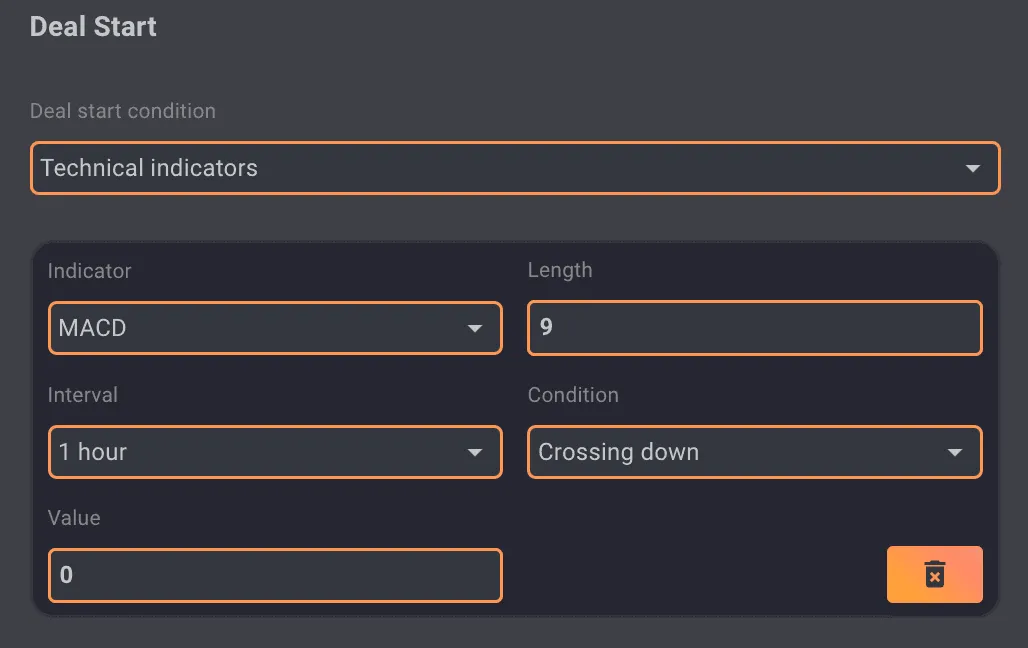 MACD
MACD
In Gainium, you can see the histogram (red and green wave) by default in the chart as soon as you select the indicator. However, to be able to see the EMA line crossing that sometimes helps better visualize your entry, you need to tick “MACD” and “Signal” in the “Style” tab in the indicator settings.
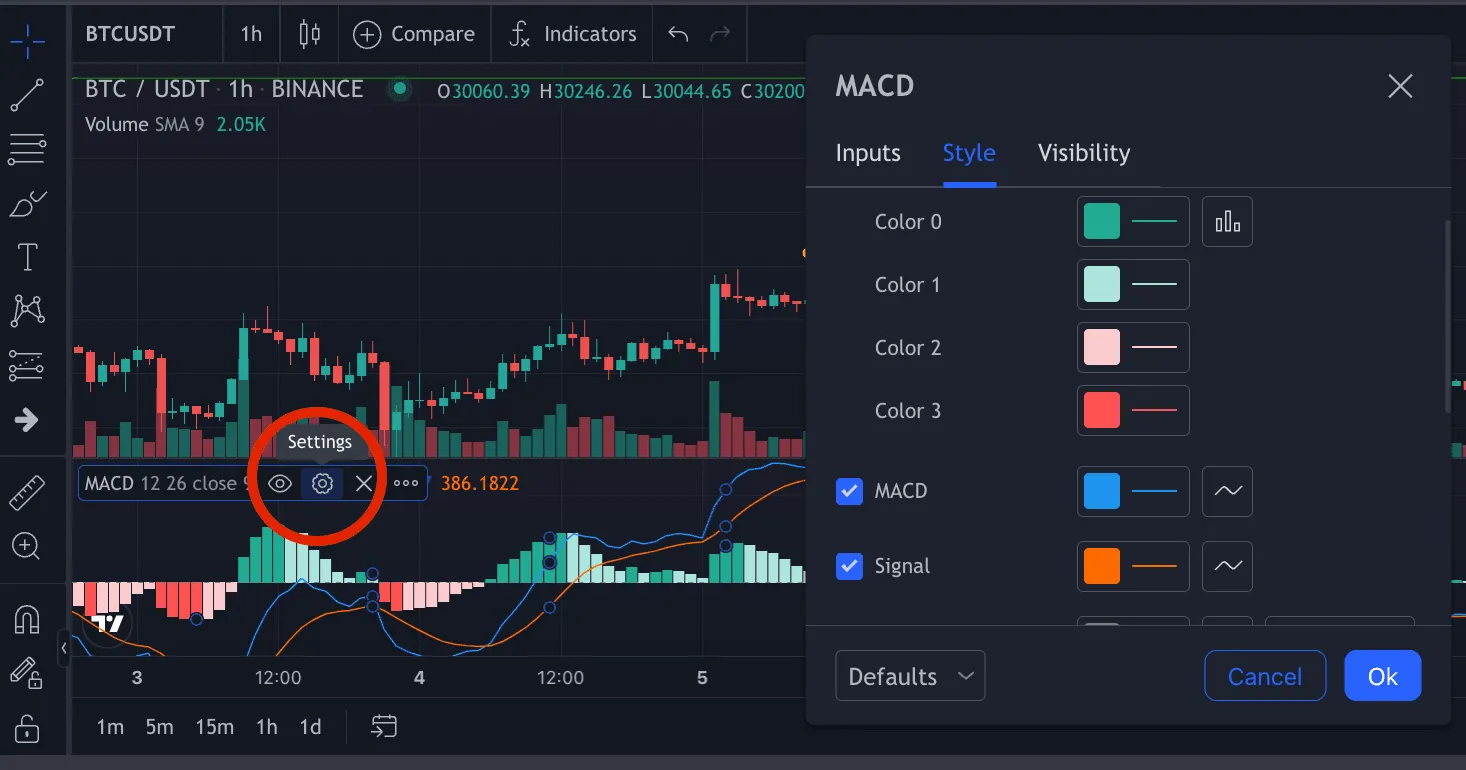 Style Settings
Implementing MACD in Your Trading Bot Strategy#
Here are a few examples of how to use the MACD indicator in your trading bots.
A. Trend reversal (MACD Crossover) Strategy#
In the crossover strategy, your trading bot will initiate a long position when the MACD Line crosses above the Signal Line, indicating a bullish trend. Conversely, the bot will exit the position or enter a short trade when the MACD Line crosses below the Signal Line, signaling a bearish trend.
For example, your bot will initiate a long position if the BTC/USDT pair demonstrates a bullish crossover with the MACD Line rising above the Signal Line. The bot will then hold onto the position until a bearish crossover occurs, prompting an exit or a short trade.
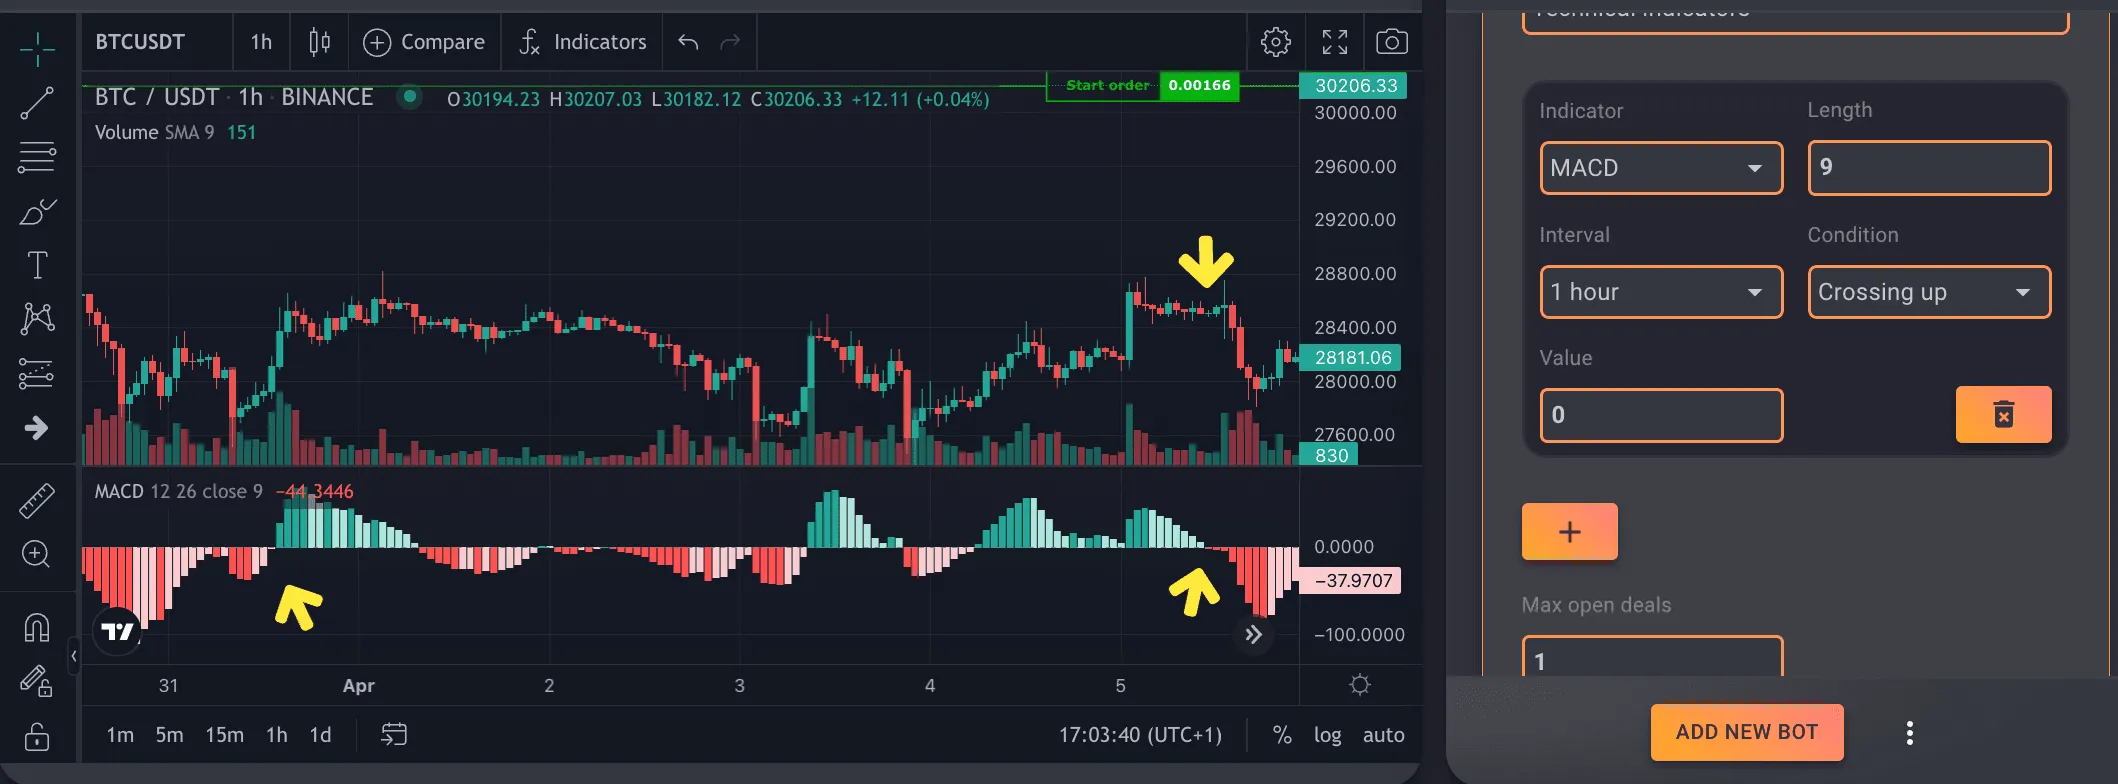 MACD crossover strategy
B. Trend continuation Strategy#
The MACD histogram displays the difference between the MACD Line and the Signal Line, visually representing their interaction. A trading bot can use the histogram to identify potential trend reversals by monitoring changes in the histogram's slope and height.
For instance, if the BTC/USDT MACD histogram shifts from negative to positive territory, it suggests a potential bullish trend, prompting your bot to initiate a long position. On the other hand, if the histogram moves from
positive to negative territory, it signals a possible bearish trend, leading the bot to exit the position or enter a short trade.
In this strategy, it is helpful to bring up the EMA lines, as you can see from the image below. The fast 12 EMA is bouncing on the slower 26 EMA, confirming the continuation of the trend.
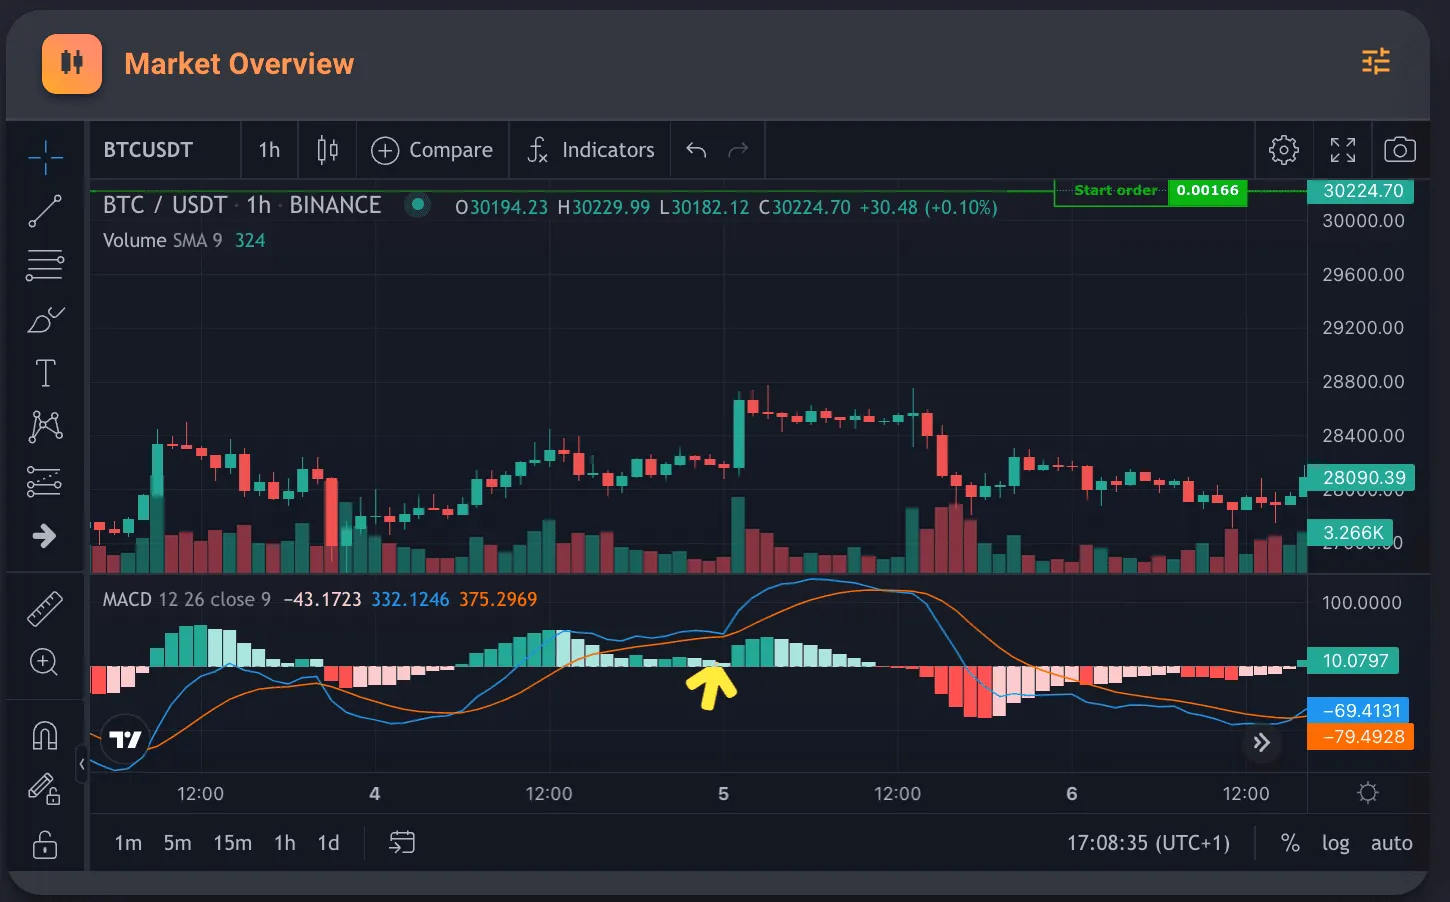 MACD trend continuation strategy
C. MACD Divergence Strategy#
Divergence occurs when the price movement of a digital asset and the MACD indicator deviate from one another. Positive divergence happens when the price hits a lower low, but the MACD forms a higher low, suggesting a potential bullish reversal. Negative divergence transpires when the price reaches a higher high, while the MACD forms a lower high, indicating a possible bearish reversal.
Using the BTC/USDT pair as an example, if the price reaches a new low while the MACD forms a higher low, your bot can initiate a long position, anticipating a bullish trend. Conversely, if the price creates a new high and the MACD forms a lower high, the bot can exit the position or enter a short trade.
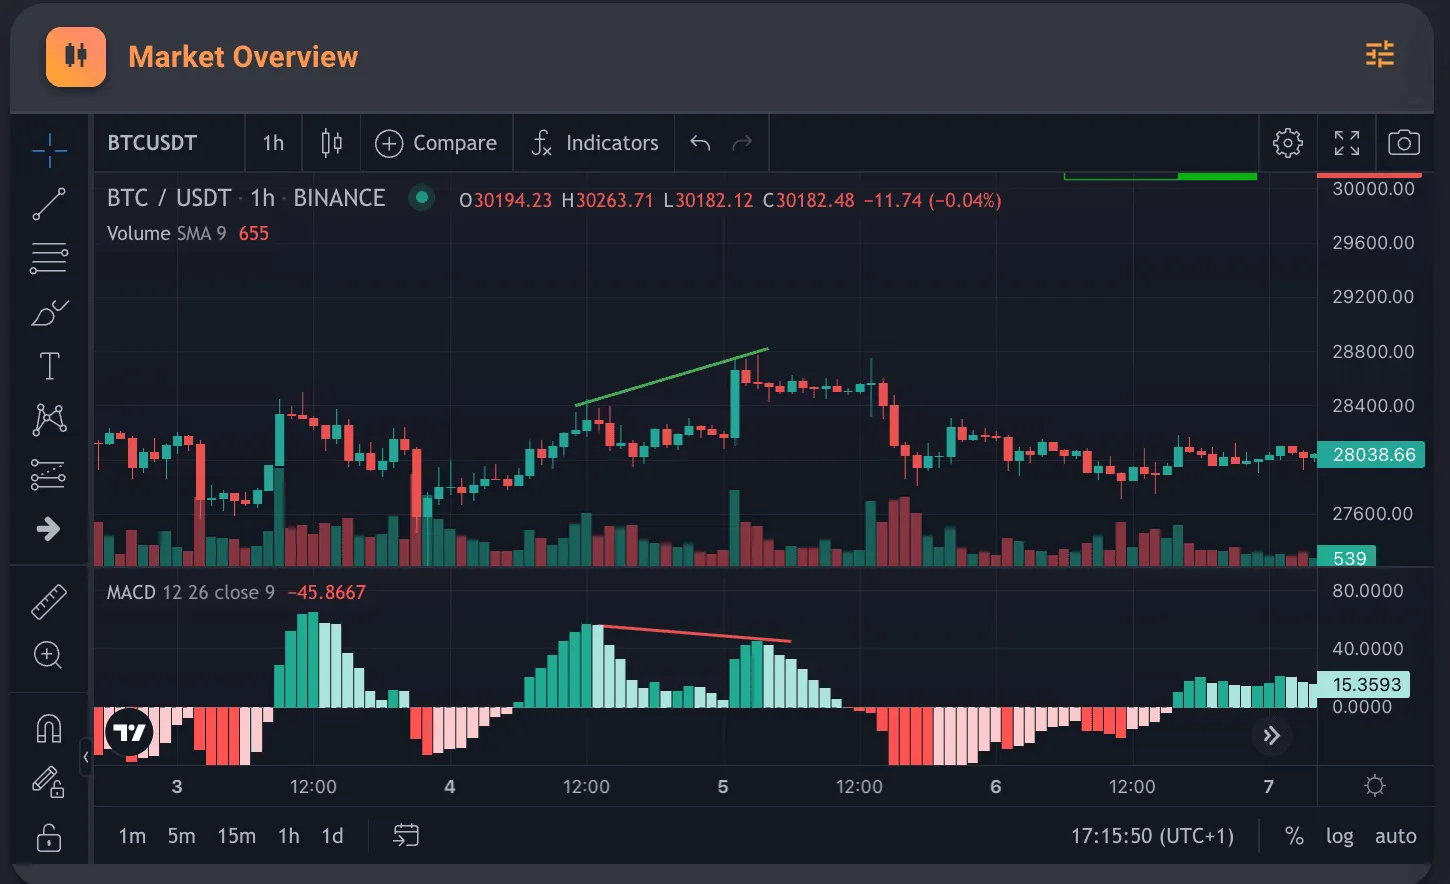 MACD divergence
Conclusion#
The MACD indicator can provide valuable insights into your crypto trading bot's market trends and potential trading opportunities. As with any trading strategy, testing and fine-tuning the parameters to suit your risk tolerance and market conditions is essential. Combining the MACD with other technical indicators and fundamental analysis can further improve the effectiveness of your trading bot and contribute to a well-rounded investment approach.