Parabolic SAR Indicator (PSAR)
In this article, we explain what is the Parabolic SAR Indicator (PSAR) indicator and how it can be used in bot trading.
TL;DR
The Parabolic SAR (Stop and Reverse) indicator identifies potential trend reversals by plotting dots above or below price bars. In Gainium, it can be used for trend-following strategies, setting dynamic stop-loss levels, or combined with MACD for reversal confirmation.
Indicators are important in bot trading because they assist bots in identifying probable buy and sell signals in the market based on past price and volume data. Indicators such as the Parabolic SAR Indicator (PSAR) assist traders and investors in understanding the asset's underlying trend and momentum. In this post, we'll look at how to use the PSAR indicator effectively in your automated trading system.
The Parabolic SAR Indicator#
The Parabolic SAR (Stop and Reverse) is a technical analysis indicator used by traders to help identify potential trend reversals in the price of an asset, such as stocks, commodities, or currencies. The indicator was developed by J. Welles Wilder and introduced in his book "New Concepts in Technical Trading Systems" in 1978.
The Parabolic SAR indicator comprises a sequence of dots shown on a chart above or below the price bars, depending on the trend. The main purpose of the Parabolic SAR is to provide traders with potential entry and exit points and help them set trailing stop-loss orders.
How the Parabolic SAR works:#
- Uptrend (Bullish Trend): When the Parabolic SAR dots are plotted below the price bars, it suggests an uptrend. The dots gradually move upward and get closer to the price bars as the trend continues.
- Downtrend (Bearish Trend): When the Parabolic SAR dots are plotted above the price bars, it suggests a downtrend. The dots gradually move downward and get closer to the price bars as the trend continues.
The acceleration factor (AF) and the extreme point (EP) are the two fundamental components of the Parabolic SAR calculations. The acceleration factor starts at a certain value and then increases over time, accelerating the rate at which the dots move closer to the price bars. The extreme point represents the current trend's highest or lowest low.
The formula for calculating the Parabolic SAR dots is as follows:
- Initial SAR = Previous SAR + (Previous AF × (Previous EP - Previous SAR)) -** Acceleration Factor (AF):** Typically begins at 0.02 and rises by 0.02 every time a new extreme point is reached, with a maximum limit.
- Extreme Point (EP): For an uptrend, it's the highest high of the current trend. For a downtrend, it's the lowest low of the current trend.
Using The Parabolic SAR Indicator in Gainium#
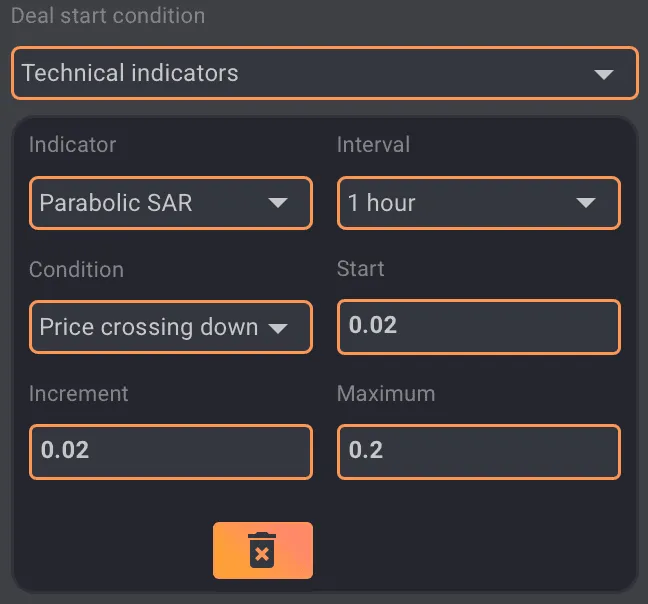
You can select this indicator by selecting “Technical Indicators” from the drop-down menu first, then “Parabolic SAR” in the “Indicator” Section.
 PSAR indicator
Gainium uses the default settings of 0.02 for both AF and EP.
Depending on your trading strategy, you might want to adjust these values. For example, the Parabolic SAR settings for scalping will almost certainly require more frequent reversals than a long-term trading approach; therefore, a scalper may prefer a greater AF. Wilder discovered that the default value of 0.02 worked best for him but that any value between 0.018 and 0.021 would suffice.
By increasing the Acceleration Factor, the indicator will track the price more closely, leaving less space between the indication and the price. This means that the chart will show more trading indications and reversals. When the Acceleration Factor is reduced, the indicator moves slower, leaving greater space between the price and the indicator. There will be fewer reversals. Maximum Acceleration functions similarly, albeit to a much lesser extent. During a significant price move, the MA limits how quickly the indicator can accelerate. Changes to this setting will have less impact than changes to the AF.
Implementing PSAR in Your Trading Bot Strategy#
Double PSAR strategy#
The Parabolic SAR can be used for trading strategies like trend following and reversal. Traders frequently use it with other technical indicators and chart patterns to confirm signals. As you can see from the image below, when PSAR crosses from above not always indicates a reversal of price and vice versa.
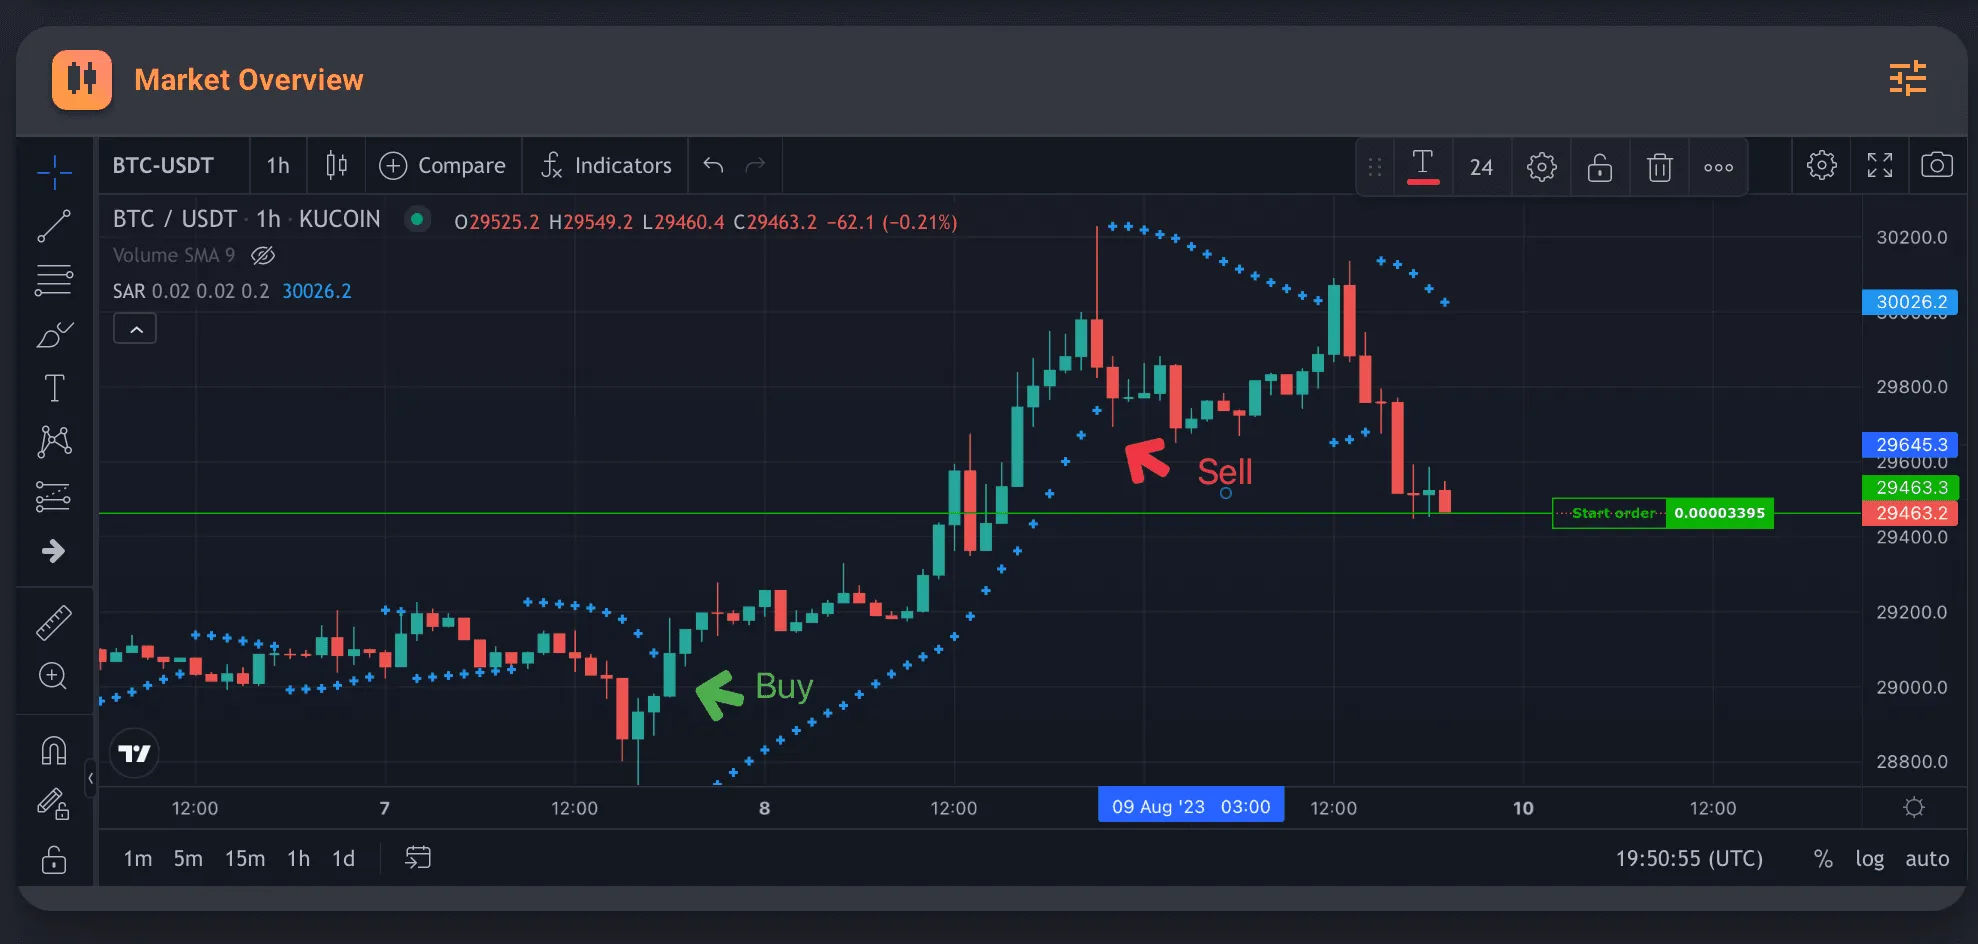
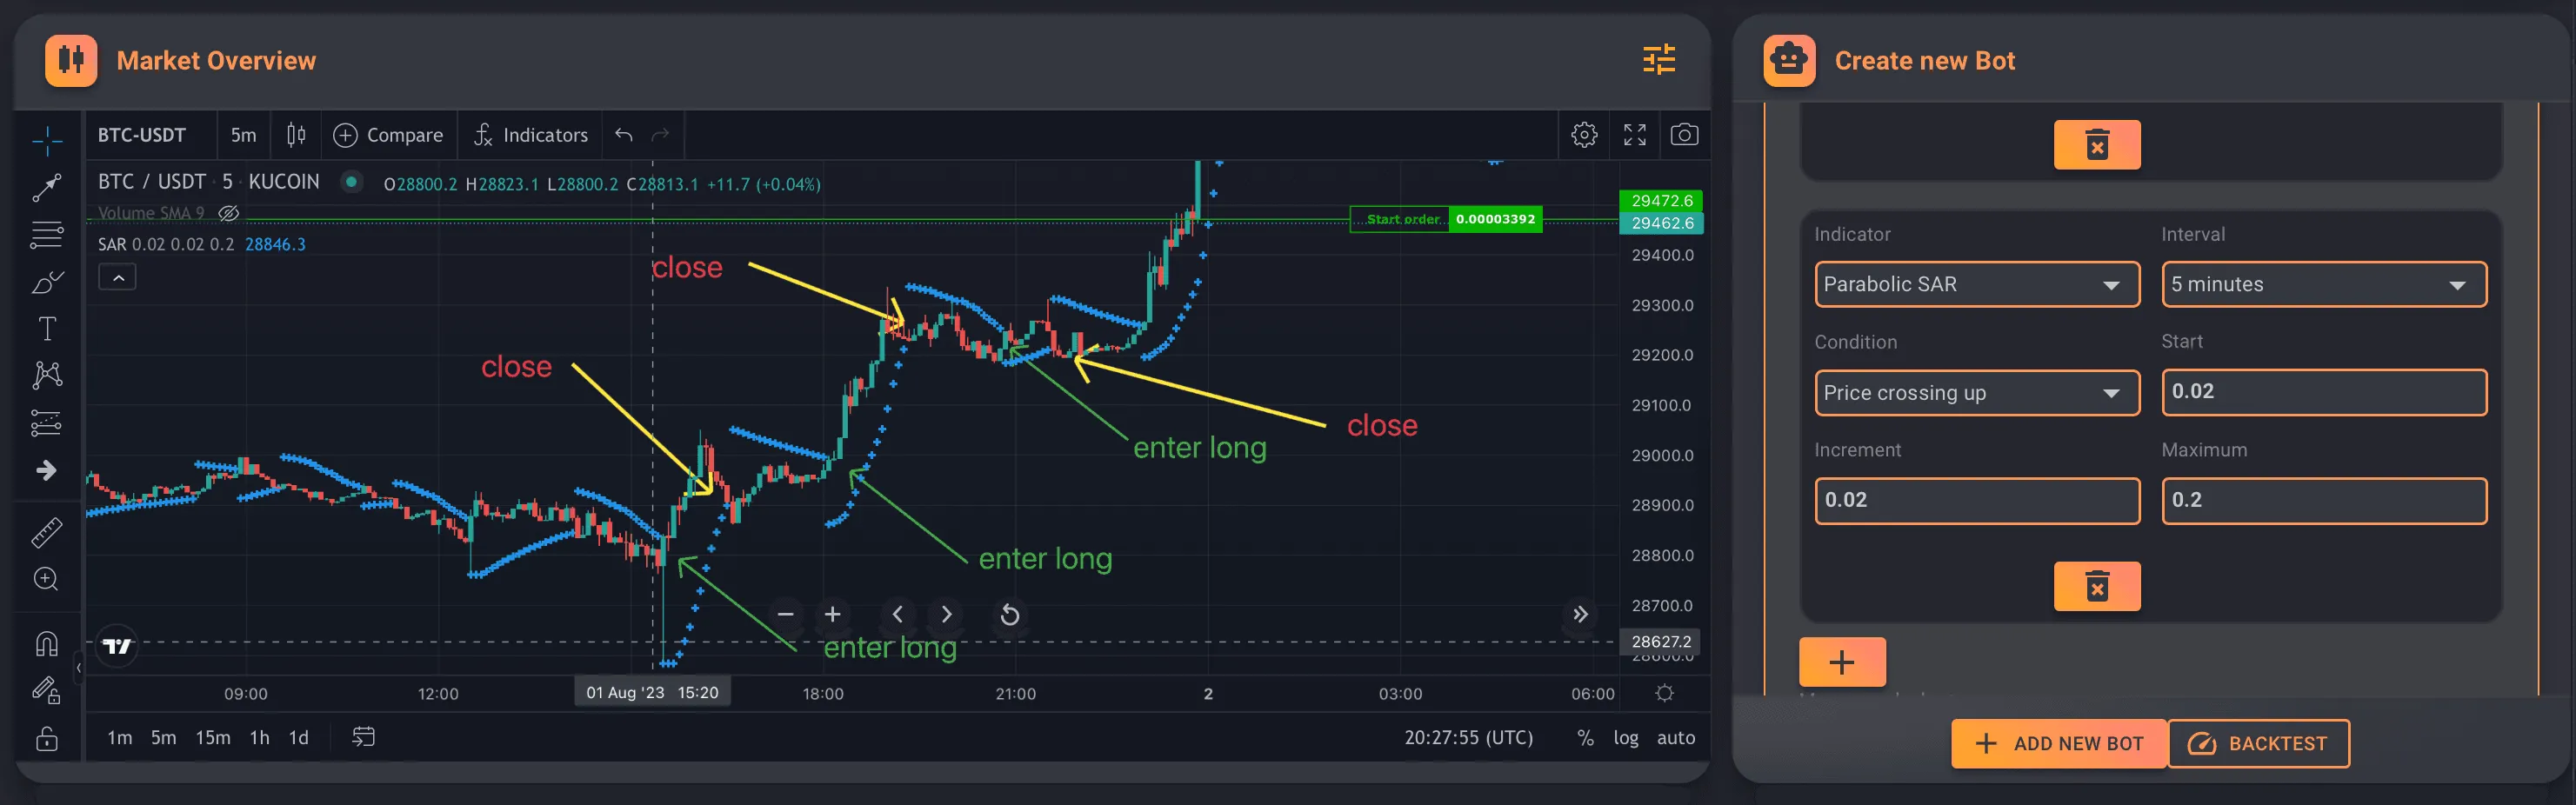
A double parabolic SAR technique employs two periods. A higher timeframe first indicates the trend direction based on the direction of the parabolic SAR. After determining the long-term trend direction, trades are entered in a shorter timeframe but only in the direction of the longer-term trend. The hourly chart of BTC (image below), with a parabolic SAR connected, reveals that the price is currently in an uptrend. As of August 1, the price is above the indication in the image below.
 1 hour TF
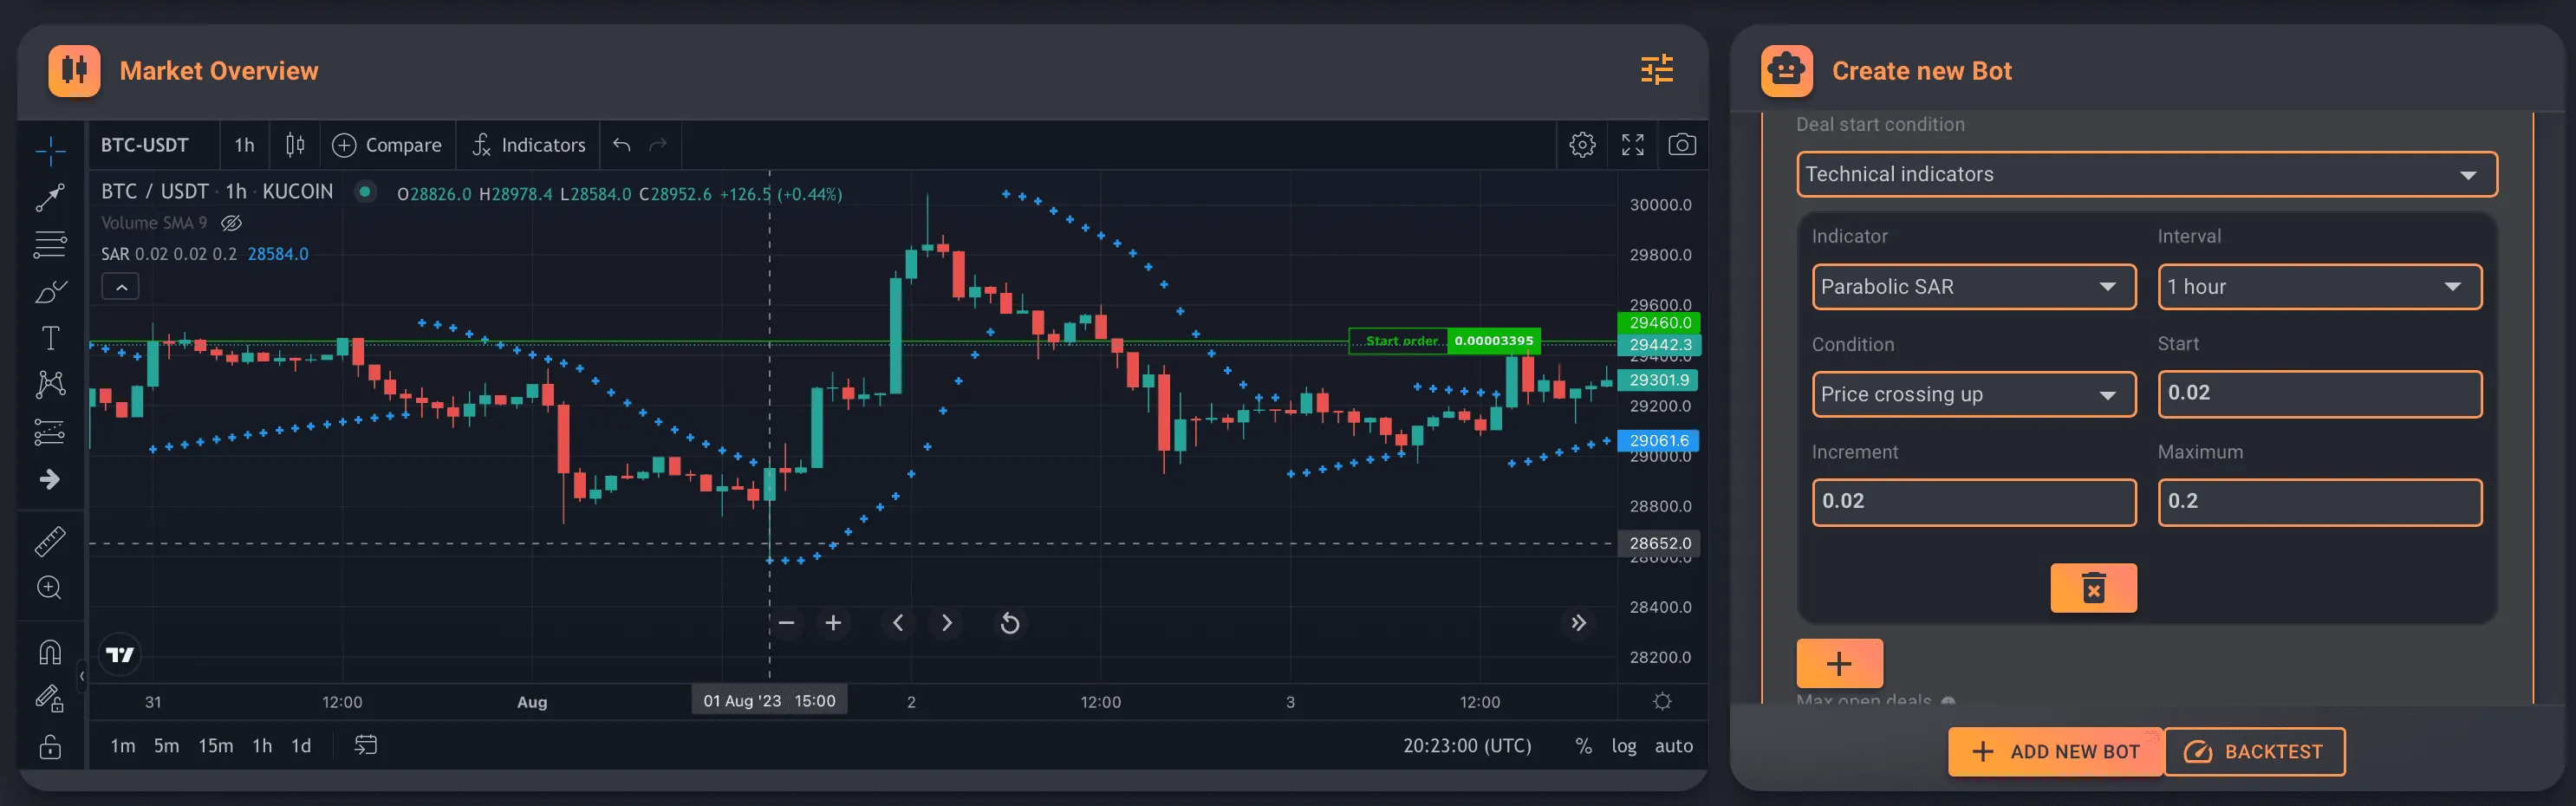
By adding a second PSAR on a different TF as a deal start condition, you can find a lot of different and more frequent entries for scalping as long as the higher timeframe indicates the continuation of the trend. A 5 min TF helps identify several entries and exits in the image below.
 5 min TF
The Parabolic Sar Breakout as a Stop Loss#
To use parabolic SAR to set stop-loss levels, place your stop-loss order at the level of the most recent dot on the opposite side of the trend. If you are long, for example, you can set your stop-loss order at the level of the most recent dot below the price. This can be easily done using the SL feature in Gainium. See the image below.
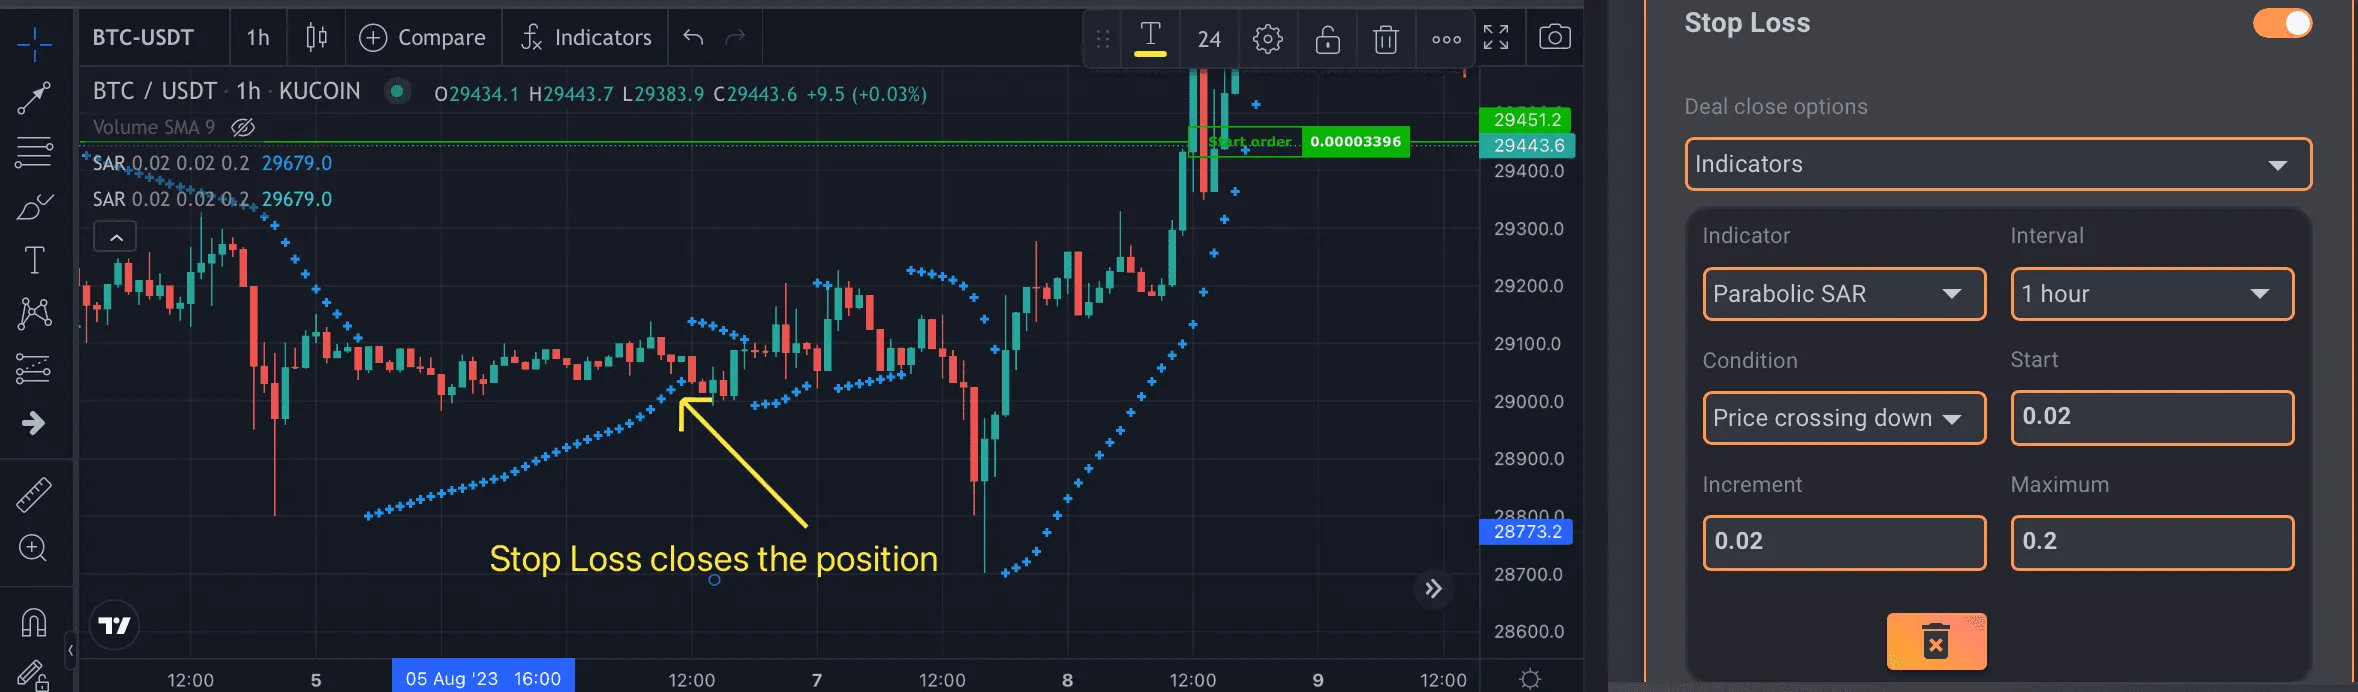 PSAR SL
PSAR and MACD crossover#
A stronger reversal can be identified using MACD indicator crossover as an additional deal start condition. In the example below, the price crossing above PSAR indicates a possible buy-long entry. By adding to the same chart the MACD crossing up, we have an additional confirmation for a long entry.
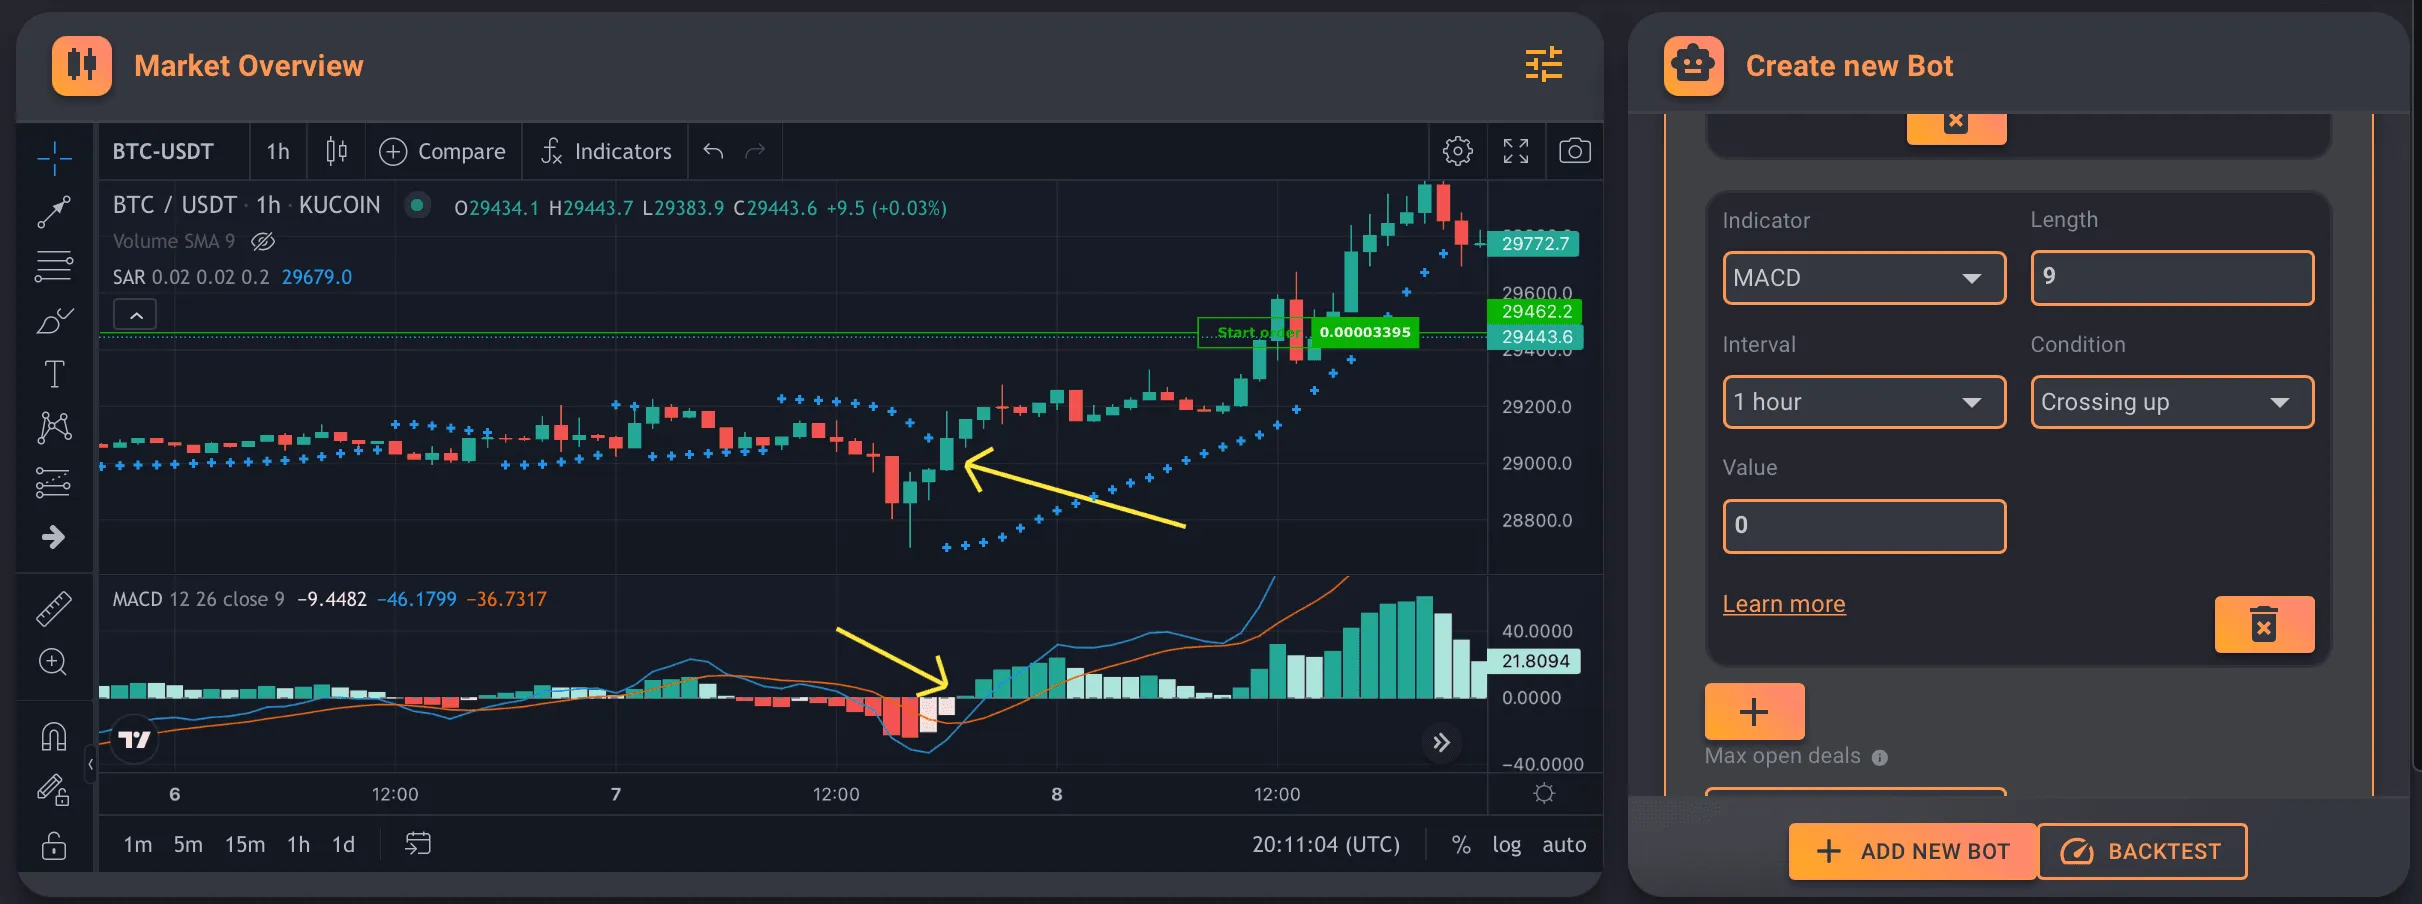 PSAR and MACD
Conclusion#
The Parabolic SAR (Stop and Reverse) indicator is a valuable tool for traders seeking to identify potential trend reversals and set trailing stop-loss orders. Its simple visual representation, with dots plotted above or below price bars, helps traders gauge the direction of a trend - upward or downward. However, like any tool, the Parabolic SAR is most effective with other indicators and analysis methods, as no single indicator guarantees success. Traders must combine the Parabolic SAR with a comprehensive trading strategy and risk management techniques for more accurate and well-rounded trading outcomes.