Support and Resistance Indicator
In this article, we explain what is the Support Resistance indicator and how it can be used in bot trading.
TL;DR
The Support and Resistance indicator plots key price levels where buying or selling pressure has historically caused reversals or breakouts. In Gainium, it can be used for breakout trading or range trading (buying at support, selling at resistance).
Understanding the core concepts of market analysis is crucial for your success as a trader. Among the most fundamental concepts are support and resistance, which can help traders identify potential entry and exit points, manage risk, and develop profitable strategies. This article will explore the nature of support and resistance, their significance in crypto trading, and how traders can leverage these concepts to create automated trading strategies.
Understanding Support and Resistance#
Support and resistance levels are price points at which supply and demand interact, creating a temporary balance between buyers and sellers. These levels act as psychological barriers in the market, often resulting in significant price reactions.
Support is a price level where buying pressure is strong enough to prevent further price declines. It represents a point at which demand for the asset is substantial enough to halt the downward trend and potentially reverse it. On the other hand, resistance is a price level where selling pressure is strong enough to prevent further price increases. It indicates a point at which the supply of the asset is significant enough to stop the upward trend and potentially reverse it.
The Significance of Support and Resistance in Crypto Trading#
Support and resistance levels play a crucial role in crypto trading. They can help traders make informed decisions about market entry and exit points, stop-loss placements, and overall risk management. Traders can use support and resistance to:
- Predict potential price reactions and reversals- Identify optimal entry and exit points for trades- Manage risk through strategic stop-loss placements- Develop effective trading strategies based on market structure
Identifying Support and Resistance Levels#
There are several methods for identifying support and resistance levels in crypto trading, including:
- Historical Price Data: By examining an asset's price history, traders can identify price levels where the asset has previously reversed or experienced significant price reactions. These levels may continue to act as support or resistance in the future.
- Psychological Levels: Round numbers and key price milestones often act as psychological support and resistance levels. For example, prices like $10,000, $20,000, or $50,000 may attract increased buying or selling pressure due to their psychological significance.
- Technical Analysis Tools: Various technical analysis tools, such as trend lines, Fibonacci retracement levels, and moving averages, can help traders identify potential support and resistance levels.
Understanding the Support and Resistance Technical Indicator#
The support and resistance indicator is a custom indicator that plots support and resistance levels with breaks on the price chart. It helps users visualize key price levels where price reversals or breakouts might occur. This indicator is implemented using this script, which takes advantage of the pivothigh and pivotlow functions applied to several left and right bars to determine at which price level the asset reverted.
Using the Support Resistance indicator in Gainium#
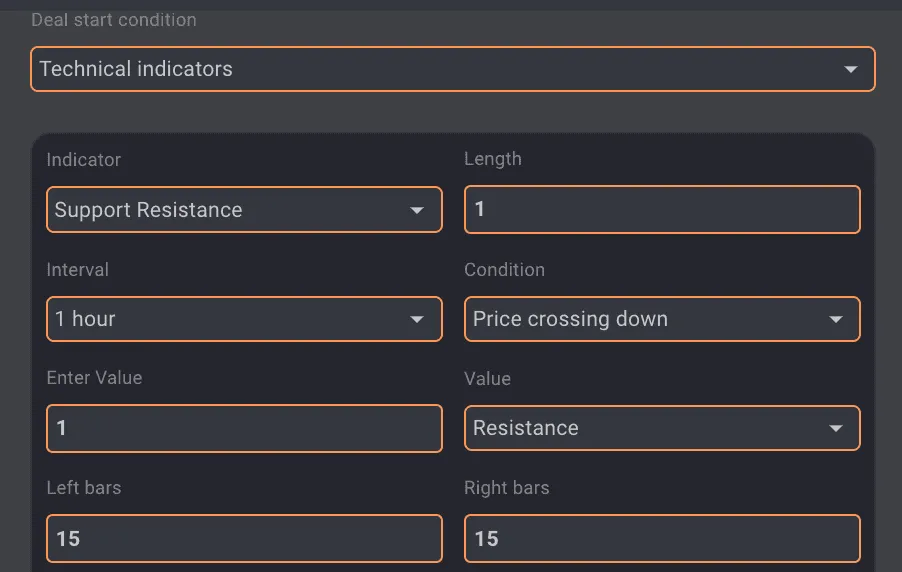
You can select this indicator by selecting “Technical Indicators” from the drop-down menu first, then “Support Resistance” in the “Indicator” Section.
 Support Resistance Indicator
The Support Resistance indicator in Gainium allows you to identify buying and selling pressure levels by selecting the condition and value within a specified timeframe. When price action is crossing down the support, the more likely the move is going to continue in that direction. This indicator is a perfect tool to spot a change in market behavior. On the contrary, when the price crosses up the resistance, it indicates a bullish sentiment.The support and resistance indicator is a visual tool that you can use to identify key levels of support and resistance on a price chart based on past price action. You can change the support and resistance levels by increasing the number of “Left bars” and “Right bars,” making the levels more conservative as the tool will have more candles to calculate the prices to generate support and resistance. If you decrease them, the levels will be less strong (fewer candles in the calculation). The default is set to 15 on a 1-hour timeframe.
Implementing Support Resistance in Your Trading Bot Strategy#
Breakout Trading#
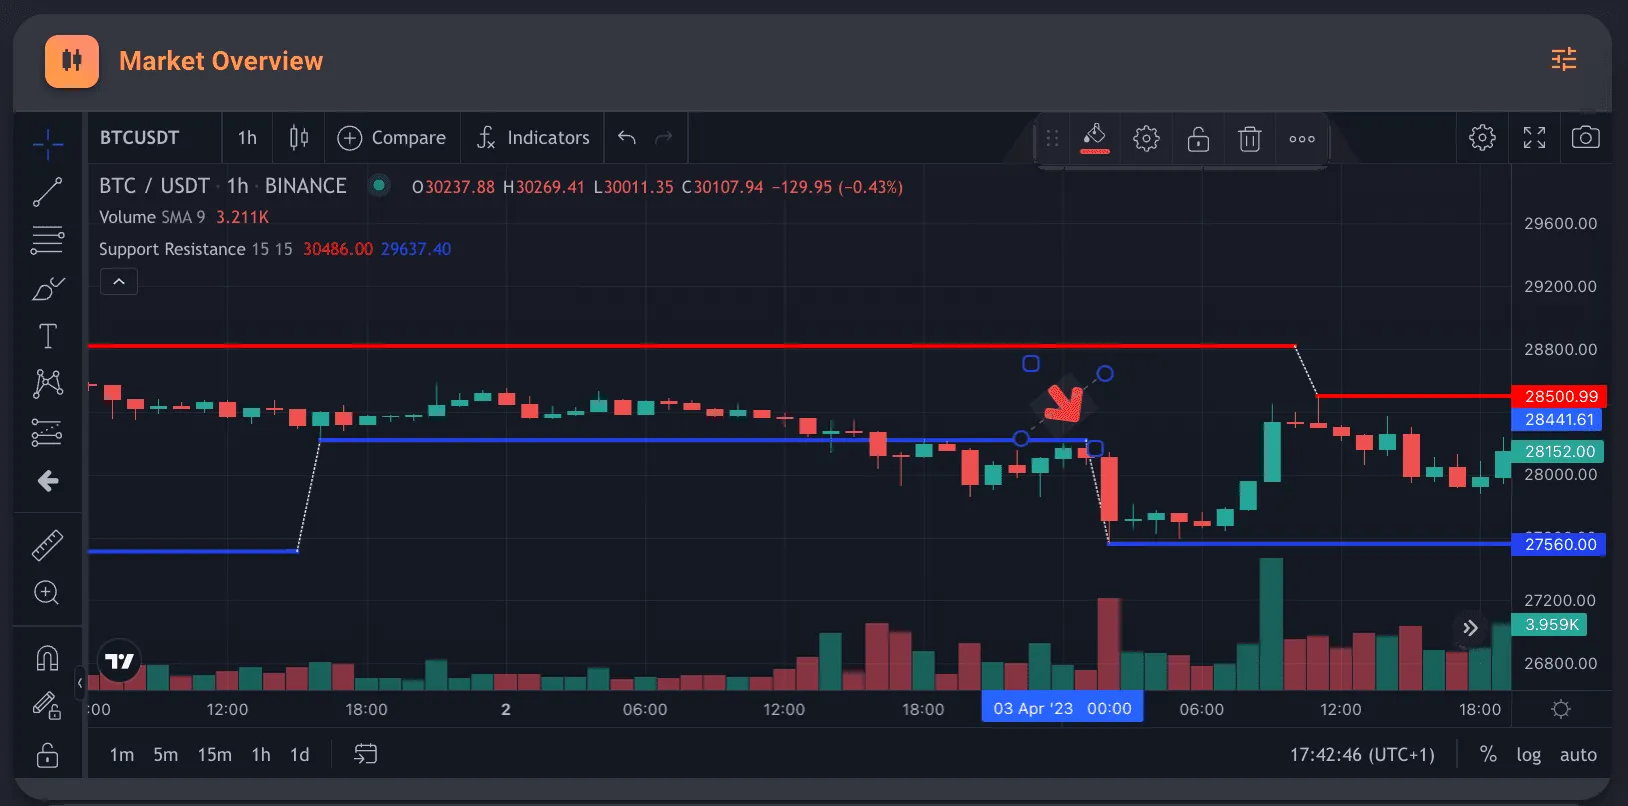
One popular trading strategy that uses support and resistance levels is breakout trading. Traders look for instances where the price breaks through a key support or resistance level and then enters a new trend. For example, if the price has been trading in a range for an extended period and then breaks through a strong support level, a trader may consider entering a short position because the asset's price is likely to continue higher. In the image below, you might want to start a short bot when the support is broken (red arrow).You can also use support and resistance levels to identify potential trade exit points. In the same example below, if you have previously entered a short position and the price approaches a strong resistance level, you may consider taking profits or exiting the trade altogether.
 Breakout
Range Trading and risk management#
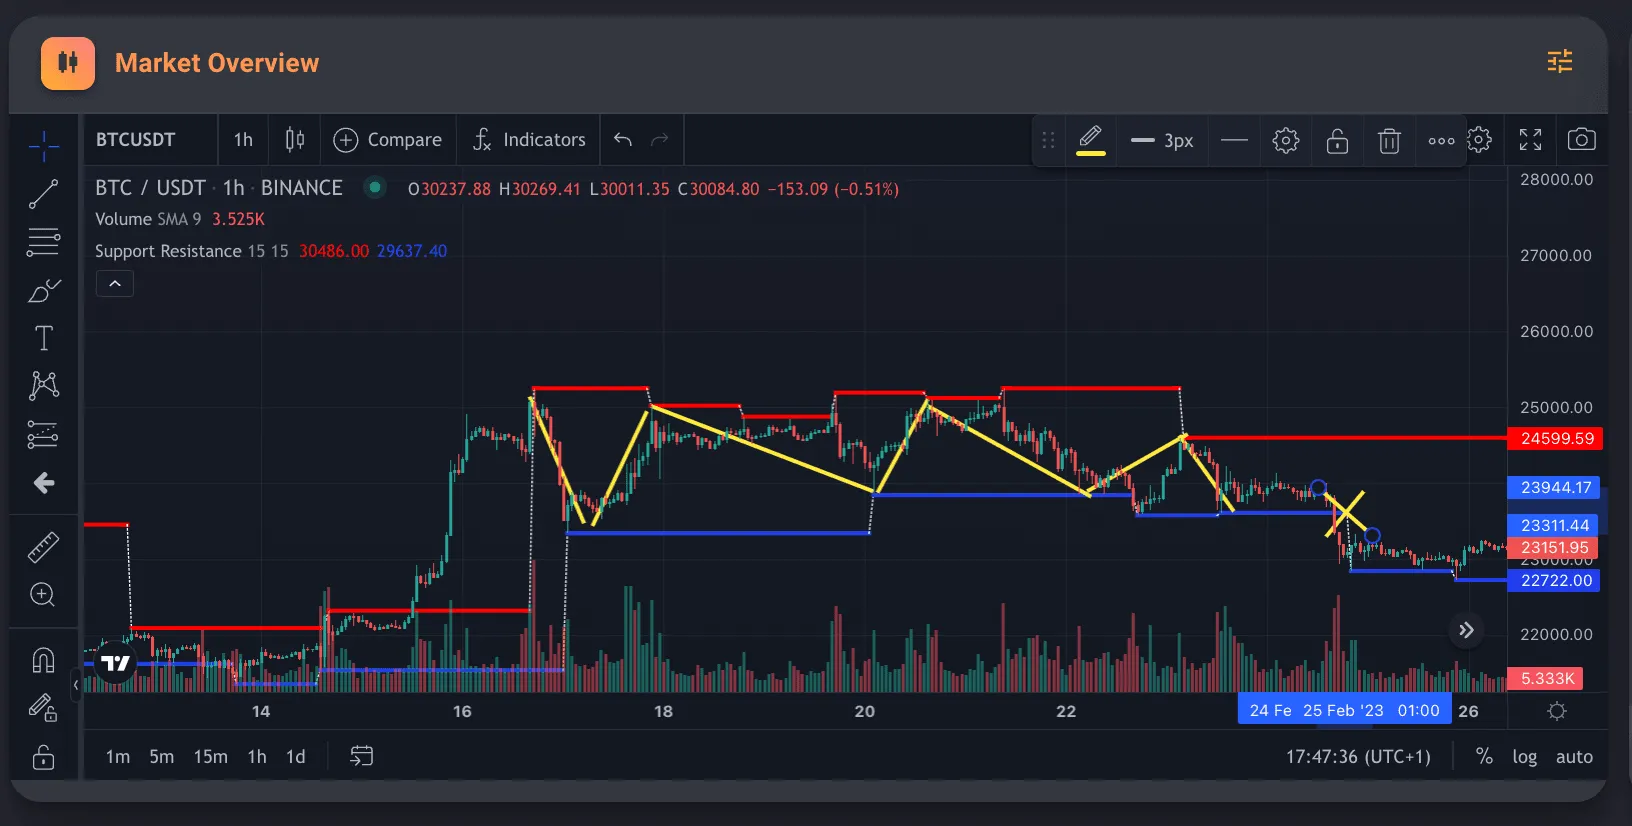
Another trading strategy that uses support and resistance levels is range trading. Traders look for instances where the price trades within a defined range between two key support and resistance levels. Traders may enter long positions when the price approaches the support level and short positions when the price approaches the resistance level. In the example below, you can open a long and short position whenever the price hits the support and resistance level ( yellow line). However, eventually, the price will break up or down (yellow cross), so you must have a stop loss in place for your risk management. You can use support and resistance levels themselves to manage risk. For example, if you have entered a long position and the price approaches a strong resistance level, they may use this level to set a stop-loss order to protect against potential losses.
 Range Trading
Conclusion#
The support and resistance indicator can be a powerful tool for traders to identify potential trading opportunities and manage risk. However, traders should use multiple sources of information and confirm the validity of support and resistance levels before making trading decisions. Backtesting is essential to fine-tune your strategy.