Money Flow Index (MFI)
In this article, we explain what is the Money Flow Index (MFI) indicator and how it can be used in bot trading.
TL;DR
The Money Flow Index (MFI) is a volume-weighted momentum indicator (0–100) that identifies overbought (>80) and oversold (<20) conditions by analyzing both price and volume data. Unlike RSI which only tracks price, MFI incorporates volume direction, making it useful for detecting divergences.
Indicators play a crucial role in bot trading as they help bots to identify potential buy and sell signals in the market based on historical price and volume data. Indicators such as the Money Flow Index (MFI) help traders and investors understand the underlying trend and momentum of the asset. In this article, we'll look into the effective use of the MFI indicator in your automated trading strategy.
The Money Flow Index Indicator#
Gene Quong and Avrum Soudack created the Money Flow Index (MFI) in the late 1990s. Quong and Soudack were technical analysts who worked for the financial services firm Shearson Lehman Brothers at the time. They developed the MFI as a tool to measure buying and selling pressure in the market by using a combination of price and volume data. It is calculated by taking the typical price (average of high, low, and close prices) for each period and multiplying it by the volume. The positive and negative money flows are then calculated based on whether the typical price is higher or lower than the previous period. The MFI is then calculated using a ratio of positive to negative money flows.
The MFI has since become a popular technical analysis indicator traders and investors use to identify trends and potential buy and sell signals. It is widely available on most charting platforms and trading software.
The MFI indicator ranges from 0 to 100. When the MFI exceeds 80, it indicates an overbought condition; when it falls below 20, it indicates an oversold condition. When the MFI value is above the value of 80 or below the value of 20, there is a higher chance that the trend could reverse. Therefore MFI is a great indicator to generate buy and sell signals in bot trading strategies.
Using The Money Flow Index in Gainium#
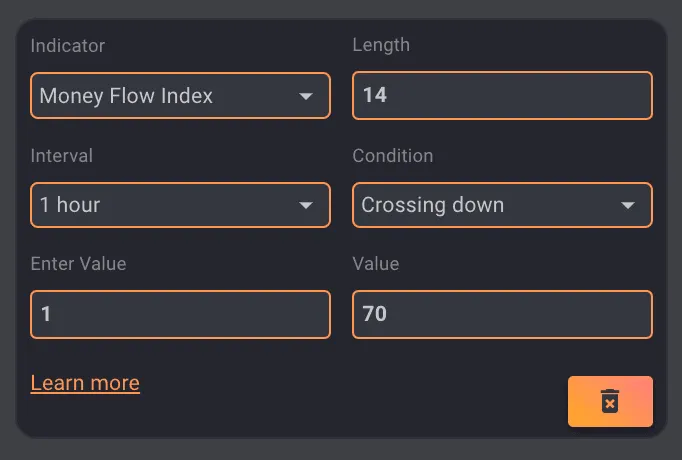
You can select this indicator by selecting “Technical Indicators” from the drop-down menu first, then “Money Flow Index” in the “Indicator” Section.
 MFI
MFI
The MFI indicator in Gainium allows you to determine the strength of buying or selling pressure in the market.
Implementing Money Flow Index in Your Trading Bot Strategy#
Because the MFI closely resembles the RSI indicator, many of the concepts that work with the RSI are also applicable to the money flow index. This also applies to the best settings. The money flow index, however, relies heavily on market volume and its direction to produce its reading, whereas the RSI only tracks market momentum as measured by the speed and change of price movements. In addition to making slightly different readings, this places the money flow index in a leading indicator position as opposed to the RSI, which is a lagging indicator. As a result, traders frequently employ the two indicators for slightly different purposes.
Identify Overbought and Oversold conditions#
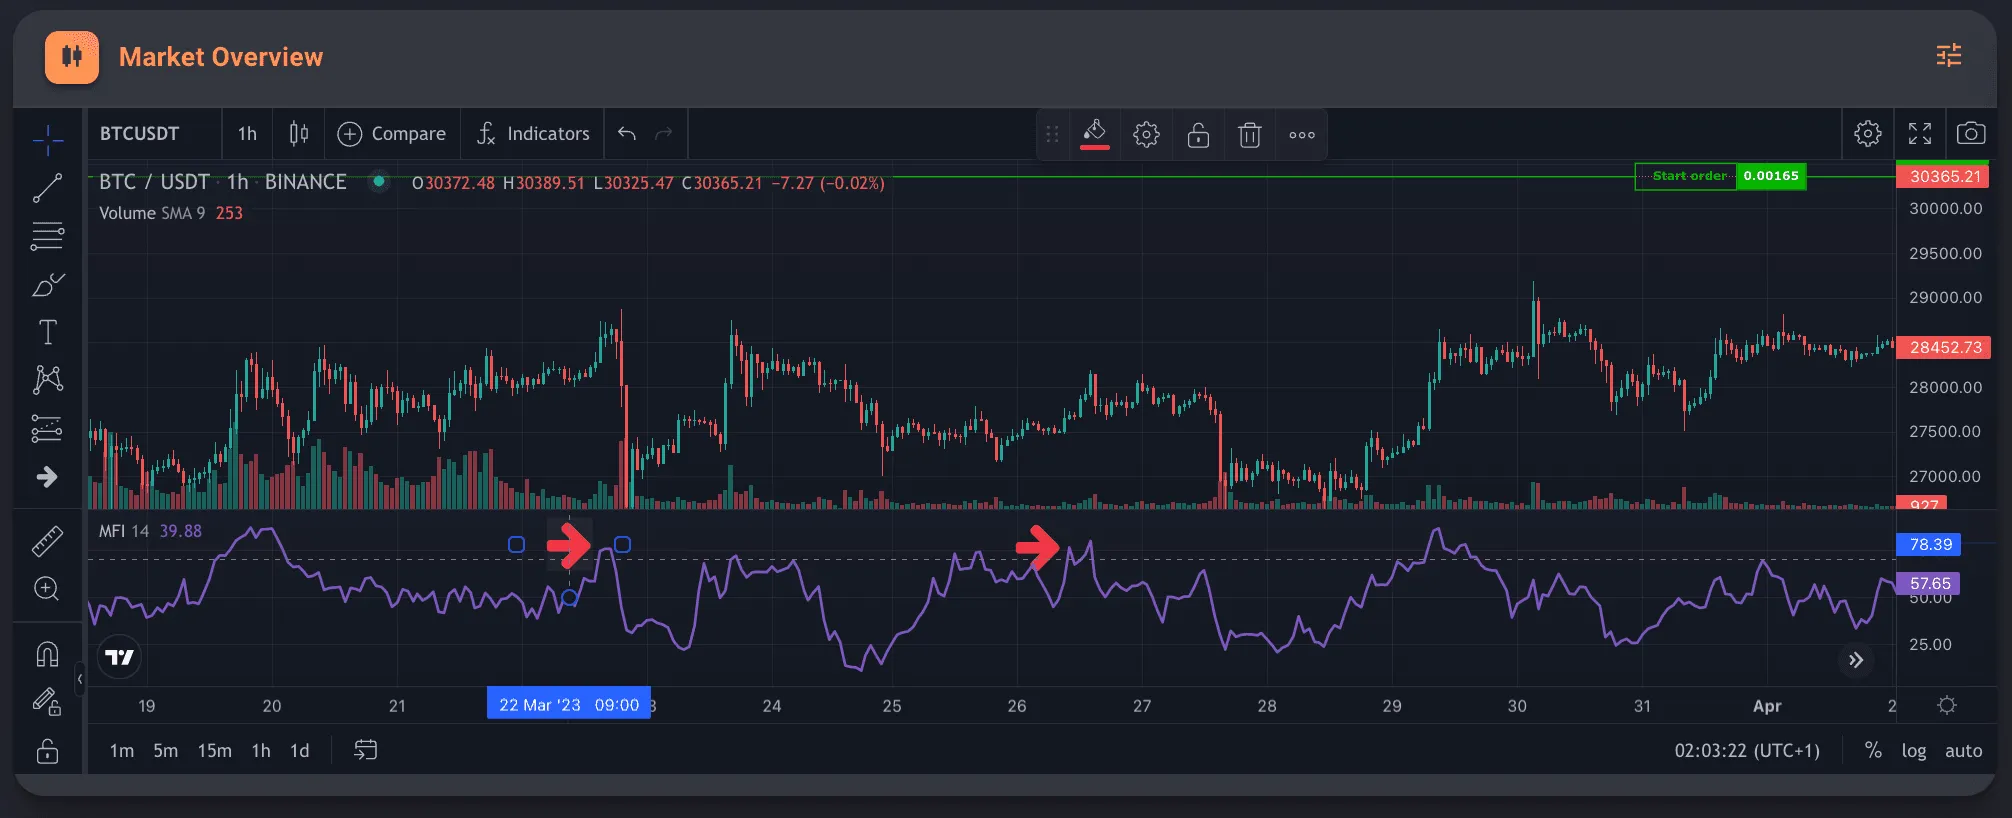
The MFI ranges from 0 to 100. A reading above 80 is considered overbought, which means that the asset is potentially due for a price correction. A reading below 20 is considered oversold, which means that the asset may be undervalued and potentially due for a price increase. In Gainium, the default value for the oversold conditions is 70. Every asset behaves differently, so you might want to adjust the values accordingly. As you can see in the image below, a short DCA bot can be started when MFI is “crossing up” the value of 70. Or, if you prefer a more conservative entry or have fewer funds for the DCA strategy, you can start a short bot when the MFI is “crossing down” the value of 70.
 Overbought example
Identify Divergencies#
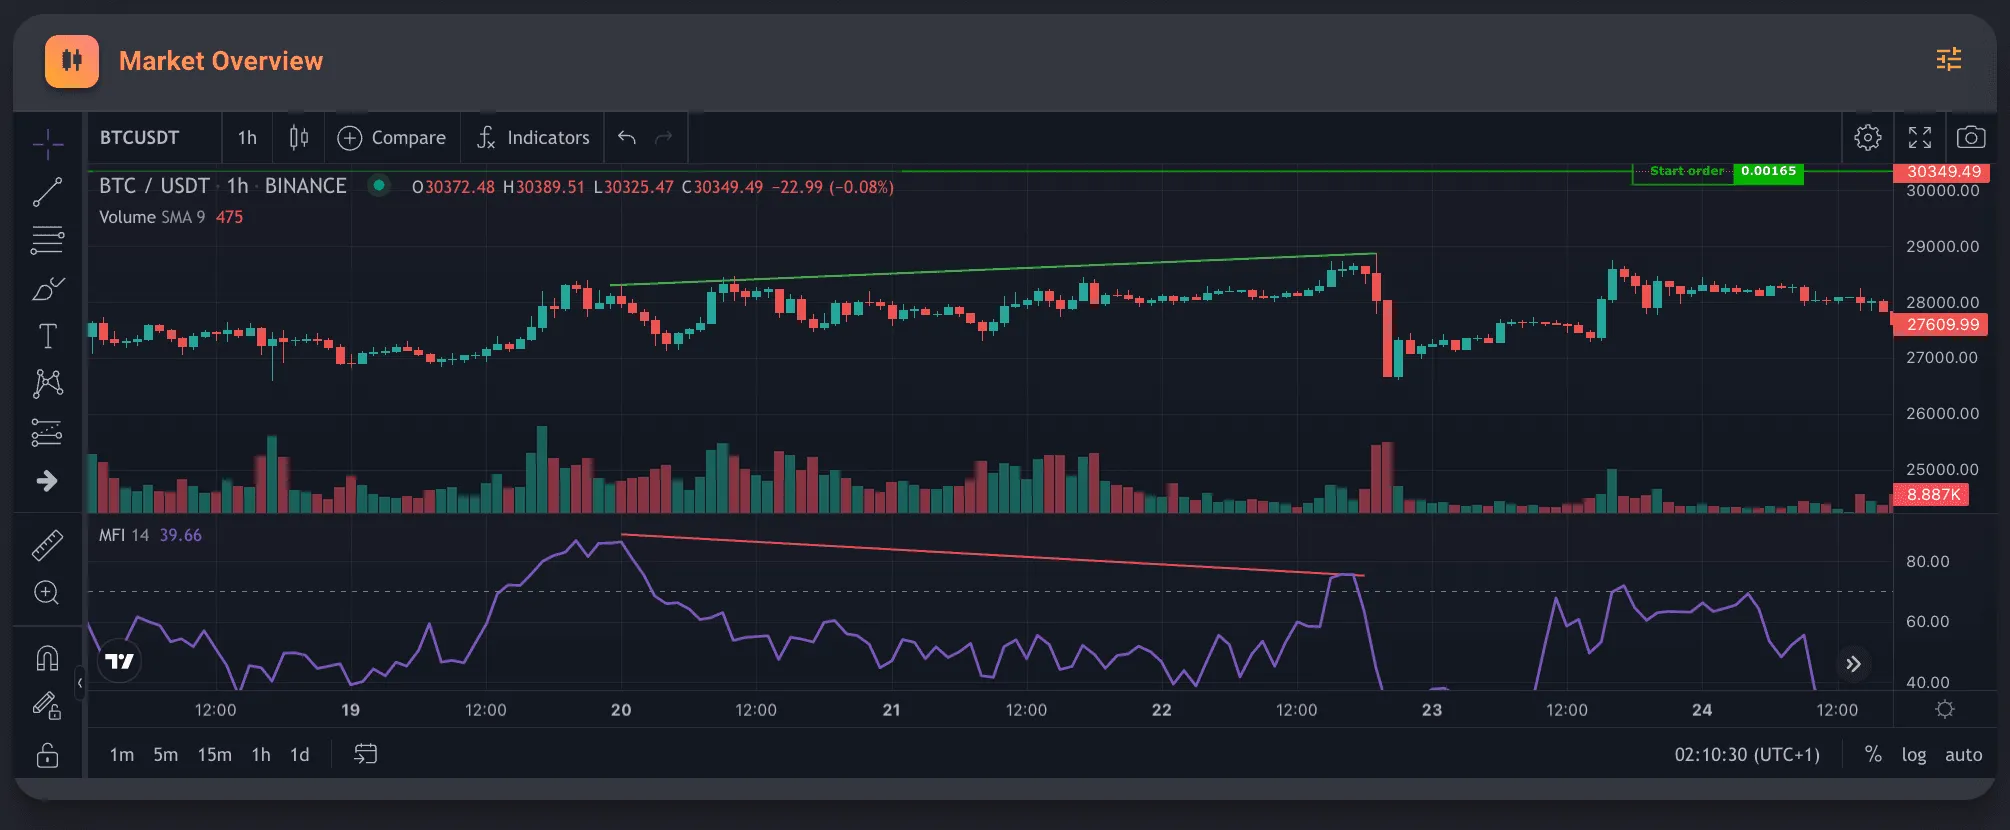
A divergence occurs when the MFI indicator moves in the opposite direction of the price trend. For example, if the price is making higher highs while the MFI is making lower highs, it could indicate a potential trend reversal. In the image below the price of BTC is rising; however, the MFI indicator is creating a lower high. Soon after, the price decreases.
 MFI DIvergence
Conclusion#
The MFI is often used with other technical indicators, such as moving averages, RSI, or trend lines, to provide a complete picture of market trends. It can be used to identify overbought or oversold conditions and potential trend reversals. However, like any technical indicator, it should not be used in isolation but in combination with other forms of analysis to make informed trading decisions.