Relative Strength Index (RSI)
In this article, we explain what is the RSI indicator and how it can be used in bot trading.
TL;DR
The Relative Strength Index (RSI) measures momentum strength, with readings below 30 indicating oversold (buy signal) and above 70 indicating overbought (sell signal). In Gainium, RSI can be used for classic overbought/oversold trading, trend confirmation, and divergence strategies.
In the rapidly changing world of cryptocurrency trading, traders are continually seeking effective tools and strategies to gain an edge in the market. One such tool is the Relative Strength Index (RSI), a widely-used technical indicator that can help identify potential entry and exit points in a trade. In this article, we'll explore the basics of RSI, how it can be applied to the BTC/USDT trading pair, and example strategies to help you maximize your profits.
The Relative Strength Index (RSI)#
Developed by J. Welles Wilder, the Relative Strength Index or RSI, is one of the most popular indicators used by traders to measure the momentum strength of an asset price action. The RSI indicator calculates the ratio of upward price movements (trader's bids) to downward price movements over a given period, typically 14 days. (As crypto is a very volatile market, the default setting in Gainium is 7).
The RSI is typically interpreted using two key threshold levels: 30 and 70. When the RSI falls below 30, the asset is considered oversold, signaling a potential buying opportunity. Conversely, when the RSI rises above 70, the asset is considered overbought, indicating a possible selling opportunity. Additionally, the RSI can be used to identify trend reversals through bullish and bearish divergences.
Using RSI in Gainium#
You can select this indicator by selecting “Technical Indicators” from the drop-down menu first, then “RSI” in the “Indicator” Section.
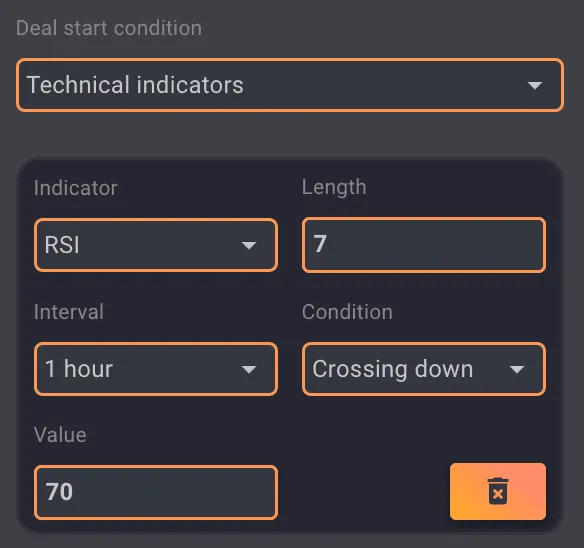 RSI
RSI
RSI Strategy for BTC/USDT: RSI BreakoutsAn RSI breakout strategy involves monitoring the RSI for breakouts from established support and resistance levels. For instance, if the RSI for BTC/USDT has been fluctuating between 40 and 60 for an extended period, a breakout above 60 or below 40 could signal the start of a new trend.
In this scenario, if the RSI breaks out above 60, a trader might consider opening a long position, anticipating a continuation of the upward trend. Alternatively, if the RSI breaks down below 40, a short position could be warranted, with the expectation of a downward trend.
Using RSI in crypto bot trading#
Examples of how to use RSI indicator in your bot trading strategies.
Classic Overbought and Oversold#
One of the simplest and most popular strategies using the RSI is to trade based on overbought and oversold conditions. In the case of the BTC/USDT trading pair, traders can monitor the RSI for levels above 70 or below 30.
For example, if the RSI for BTC/USDT falls below 30, this could signal that Bitcoin is oversold against Tether and may be due for a price rebound. In this case, a trader might consider opening a long position in anticipation of a price increase. Conversely, if the RSI rises above 70, this could suggest that Bitcoin is overbought and may be due for a price correction. Here, a trader might consider opening a short position to capitalize on the potential price decline.
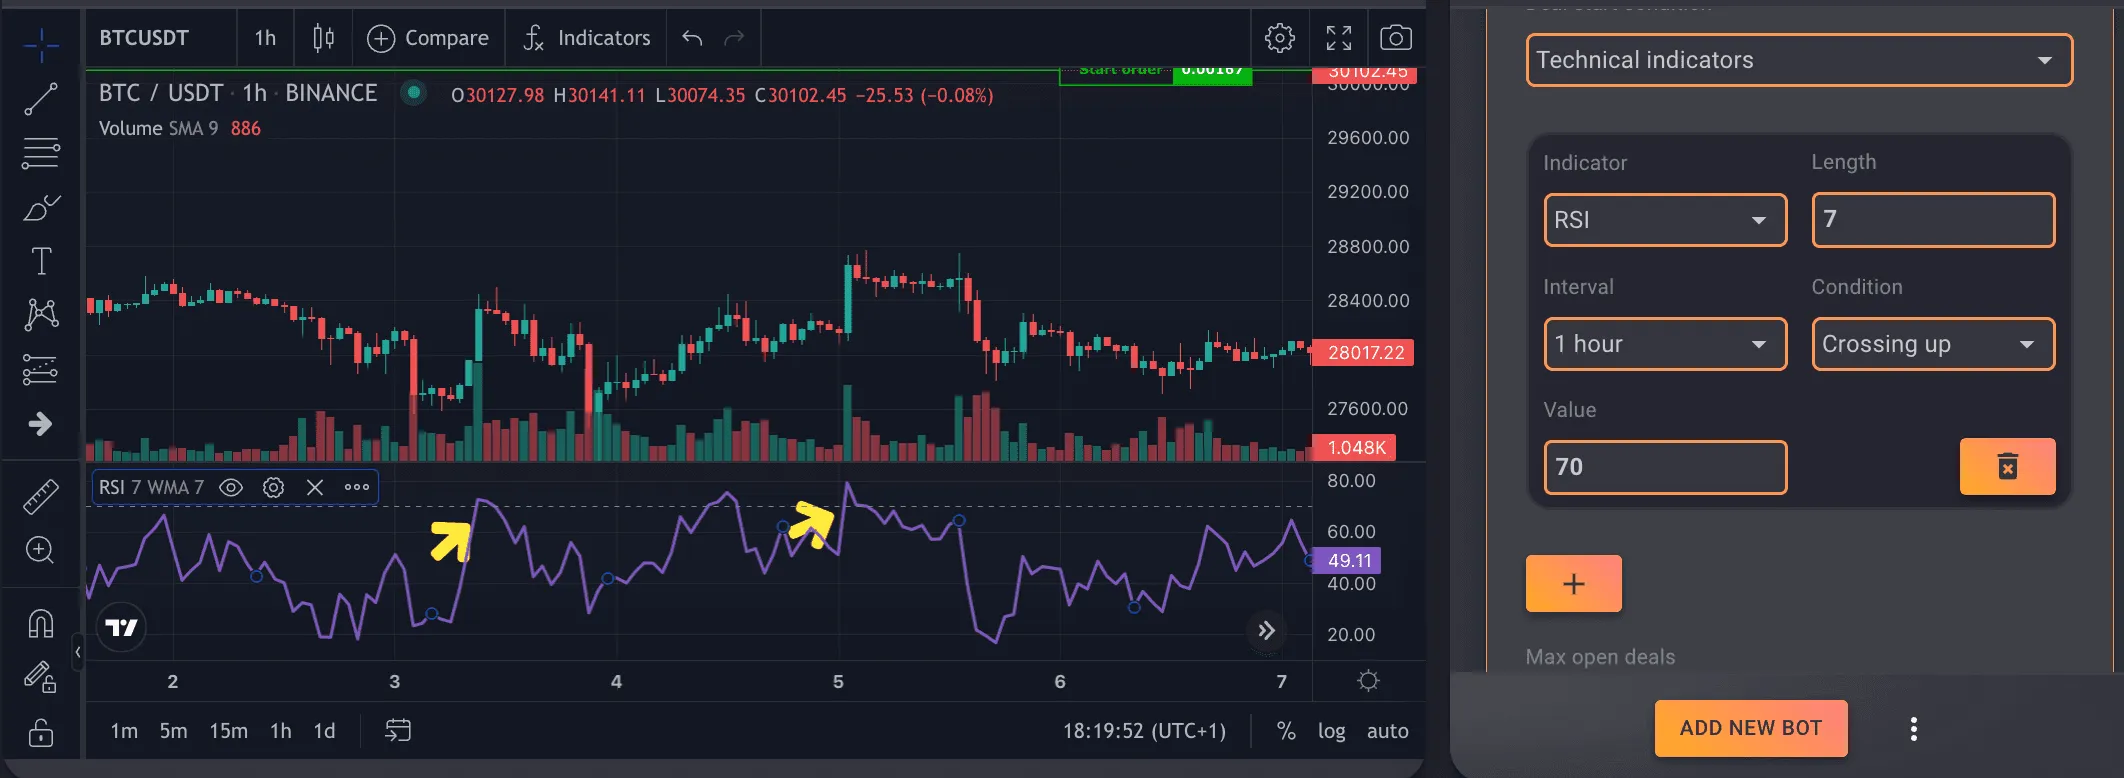 Sell when RSI above 70
 Buy when RSI is below 30
Trend Confirmation#
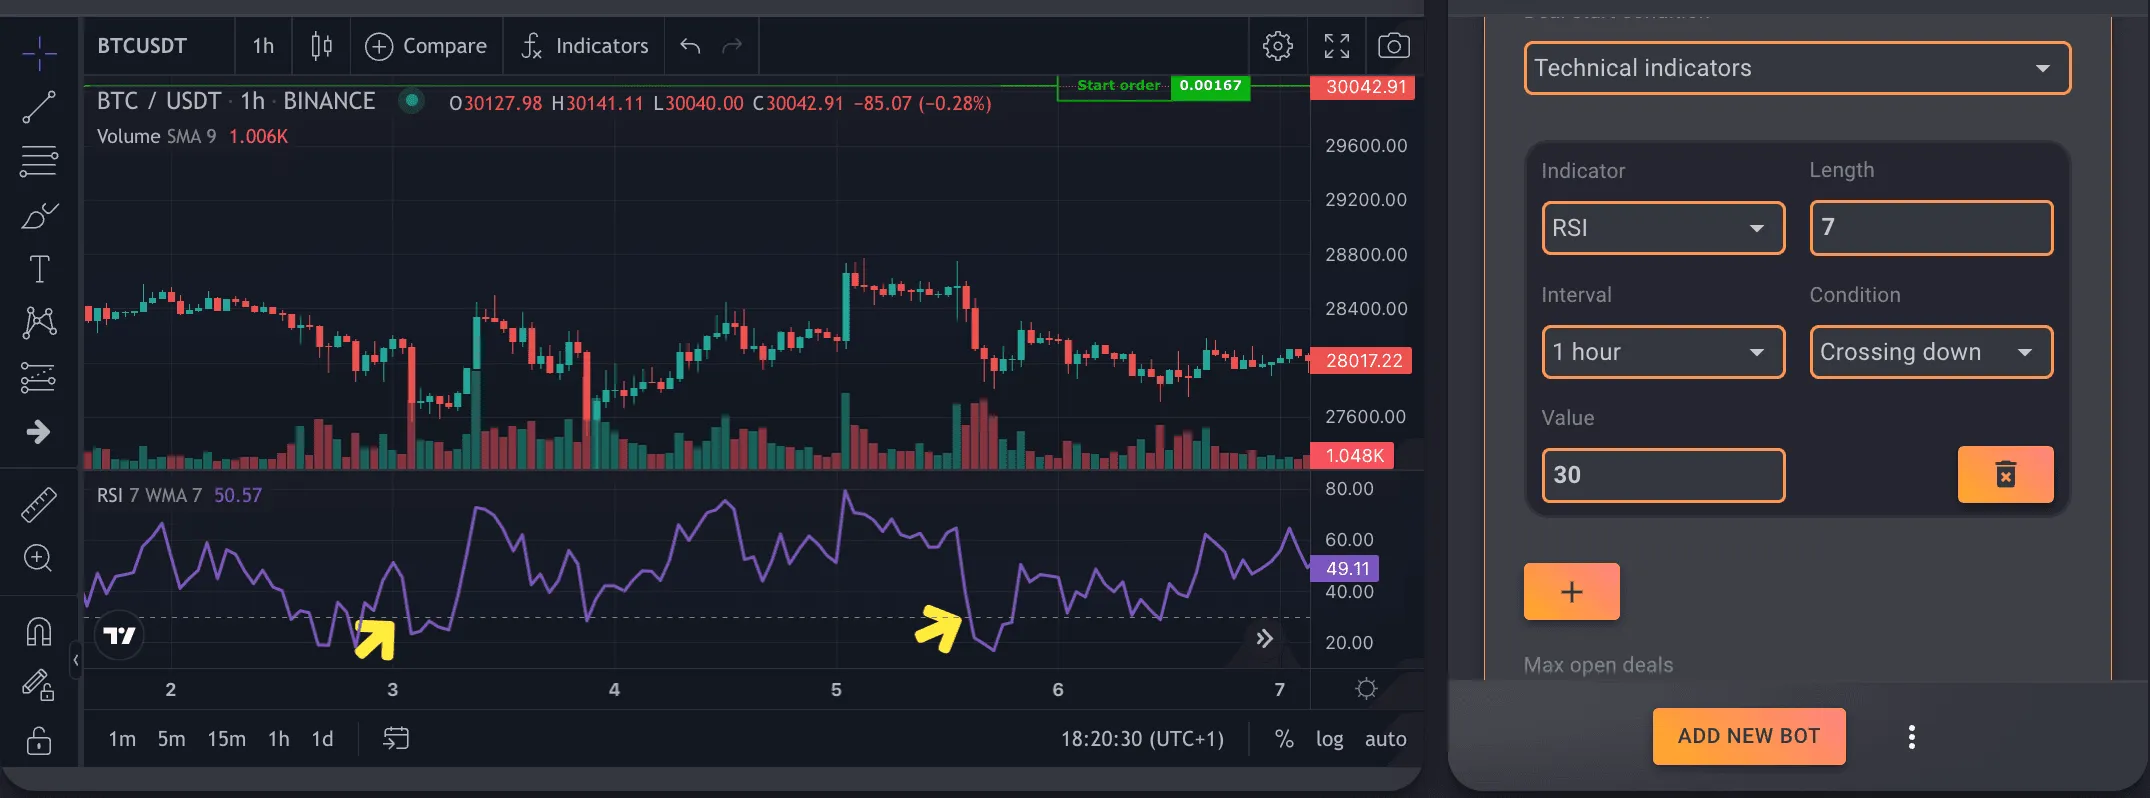
Traders may use the RSI indicator to confirm trends. For example, if the RSI value is rising along with an uptrend in price, it can indicate that the trend is solid and likely to continue. If the RSI value is falling along with a downtrend in price, it can mean that the trend is strong and likely to continue. In the example below, RSI is growing from the 30ies crossing up the 50ies in a very smooth organic way and not jumping immediately over the 70ies. This indicates that there is still room for the price to go higher. In fact, there is an excellent pump right after the 50 is crossed. The RIS value of 50 is often used to see if the trend will continue or if the price will be rejected.
 Continuation of a trend
Divergence Trading#
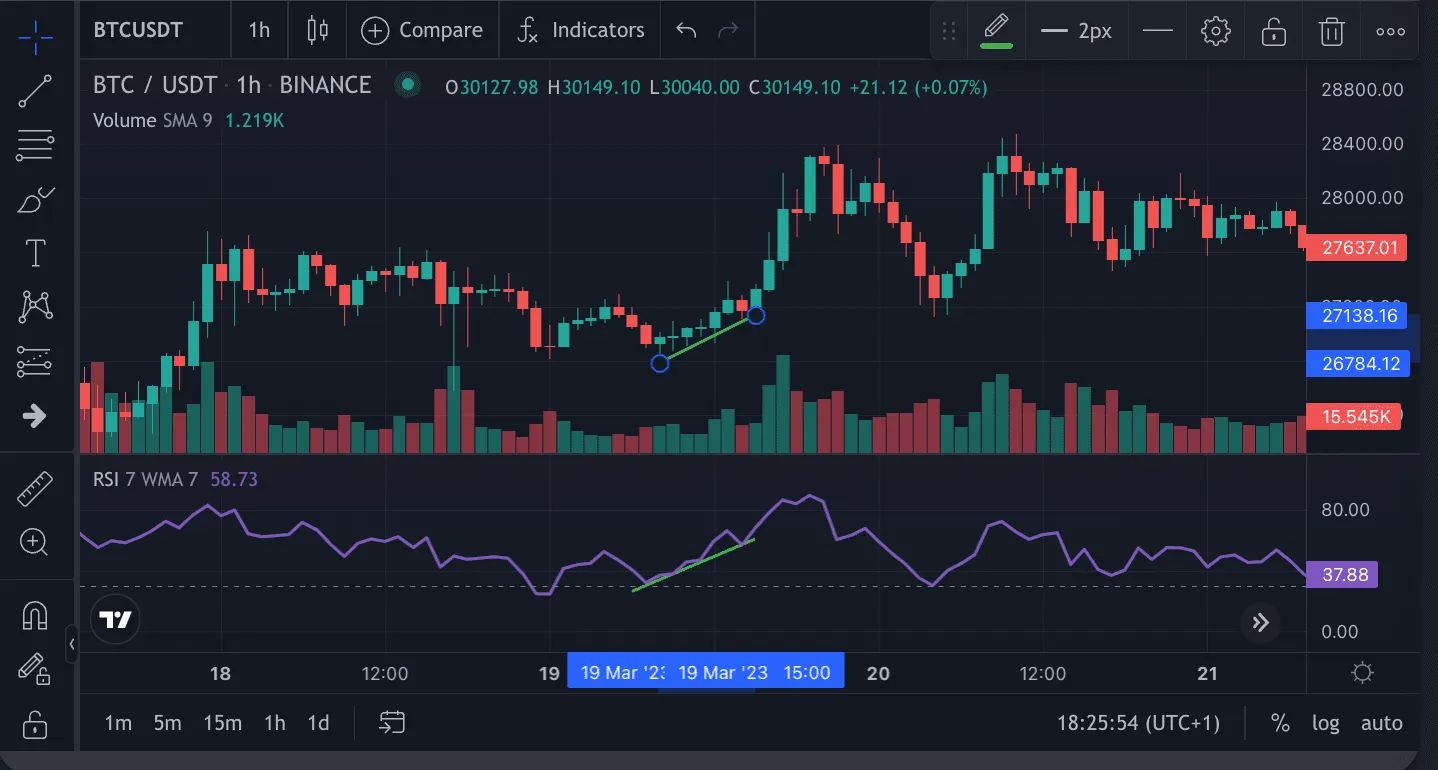
Another effective RSI-based strategy is divergence trading. A bullish divergence occurs when the price of an asset forms lower lows, while the RSI forms higher lows, suggesting that the selling pressure is weakening and a potential trend reversal is imminent. In contrast, a bearish divergence occurs when the price forms higher highs, while the RSI forms lower highs, indicating that buying pressure is decreasing and a potential trend reversal is on the horizon.
For example, if a trader identifies a bullish divergence between the BTC/USDT price and RSI, they might consider opening a long position in anticipation of an upward price movement. Conversely, a short position may be more appropriate if a bearish divergence is observed.
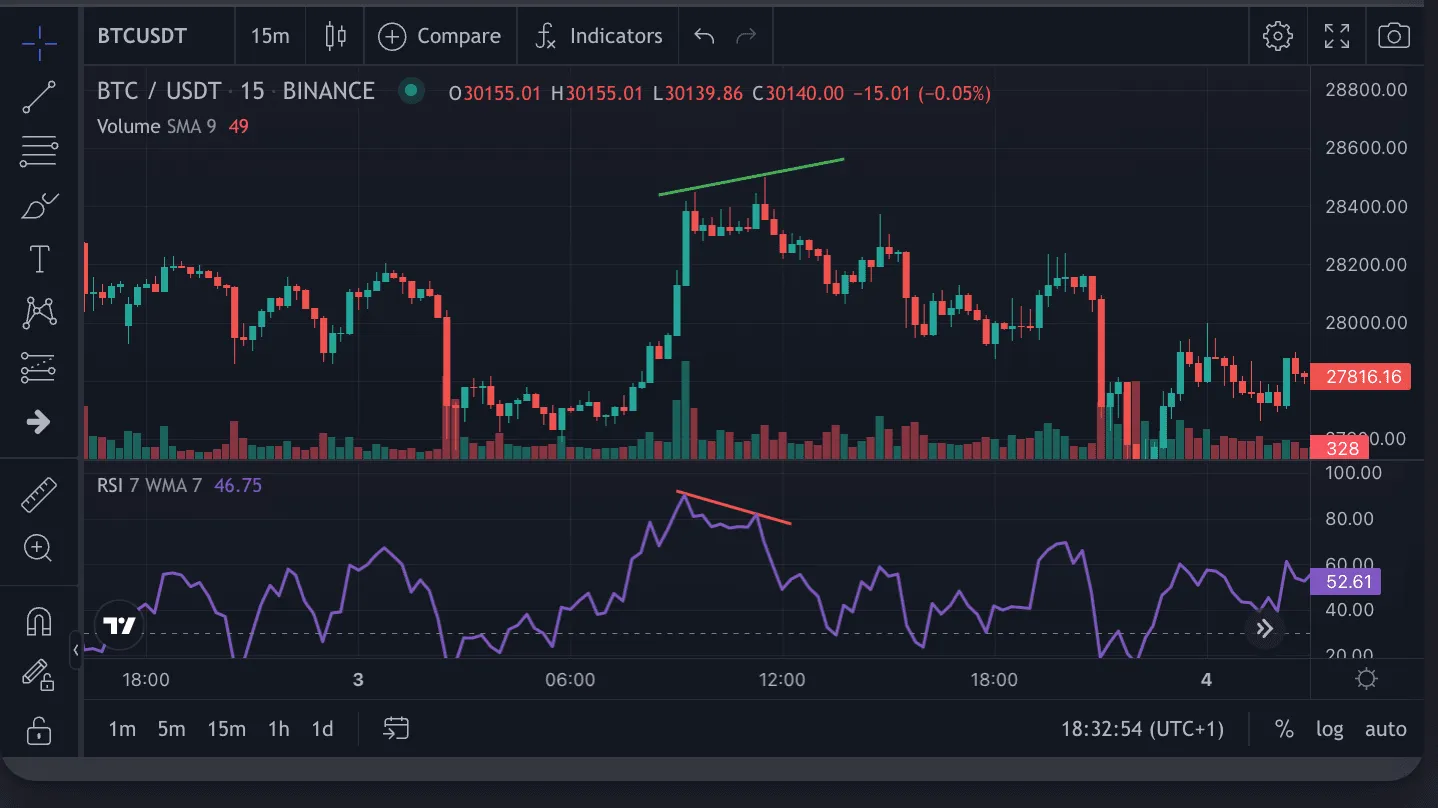 RSI divergence
RSI Breakouts#
An RSI breakout strategy involves monitoring the RSI for breakouts from established support and resistance levels. For instance, if the RSI for BTC/USDT has been fluctuating between 40 and 60 for an extended period, a breakout above 60 or below 40 could signal the start of a new trend.
In this scenario, if the RSI breaks out above 60, a trader might consider opening a long position, anticipating a continuation of the upward trend. Alternatively, if the RSI breaks down below 40, a short position could be warranted, with the expectation of a downward trend.
Indicator combinations#
Using RSI with another indicator for confirmation. The most popular combination is with MACD. To use RSI and MACD together, you could look for situations where the RSI indicates an oversold or overbought condition while the MACD gives a bullish or bearish signal. For example, Oversold with Bullish MACD: If the RSI is below 30 and the MACD line crosses above the signal line, it could be a signal to buy. Overbought with Bearish MACD: If the RSI is above 70 and the MACD line crosses below the signal line, it could be a signal to sell, as seen in the examples below.
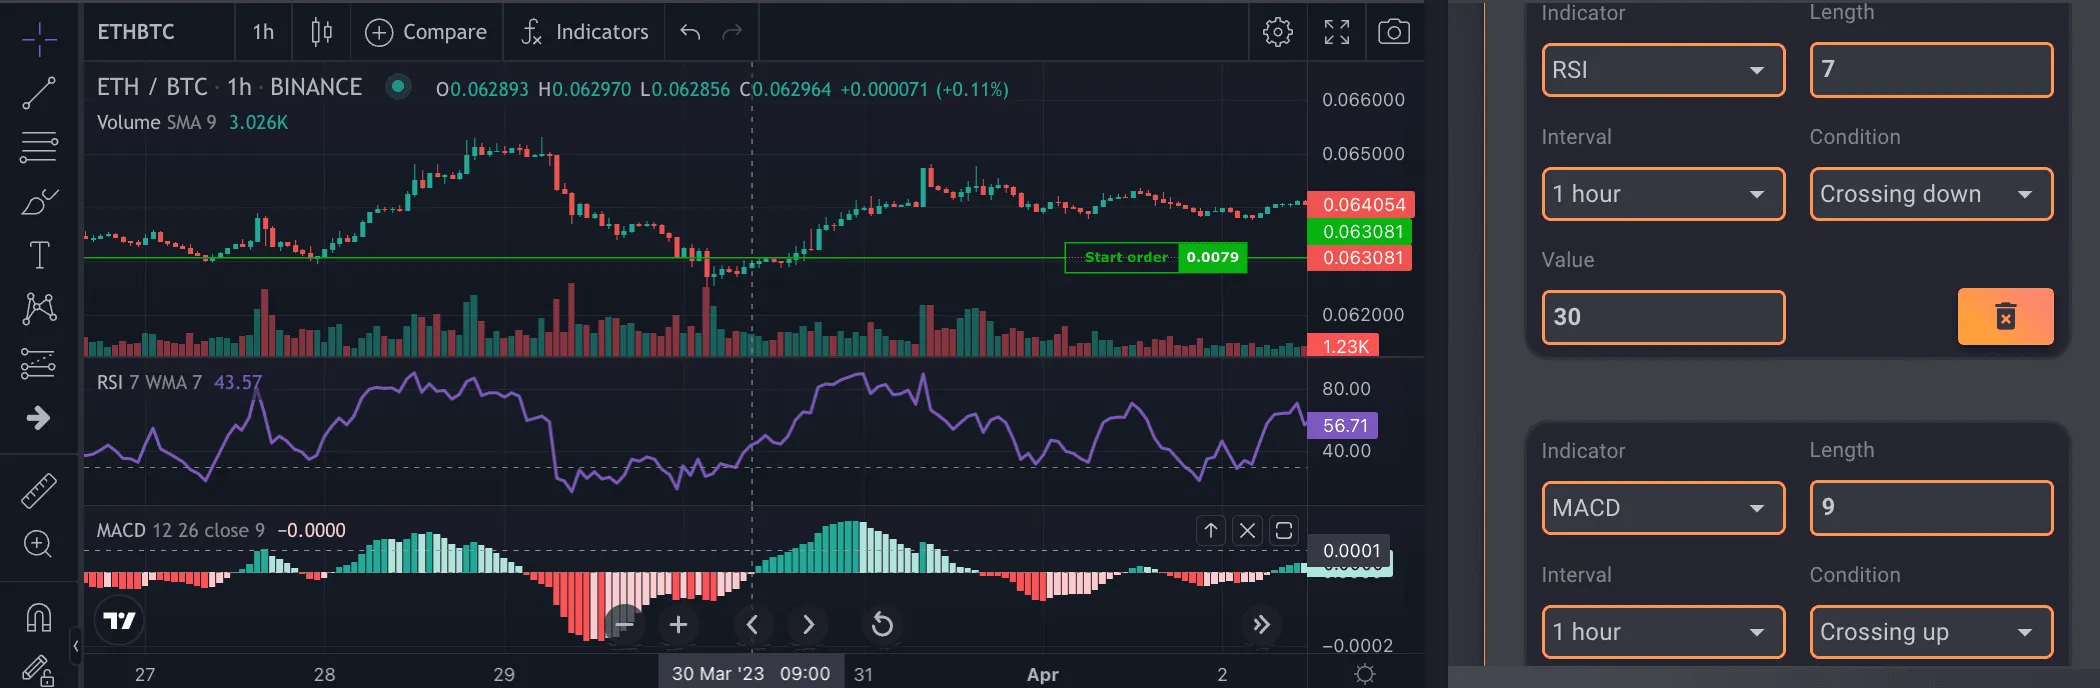 Buy SIgnal
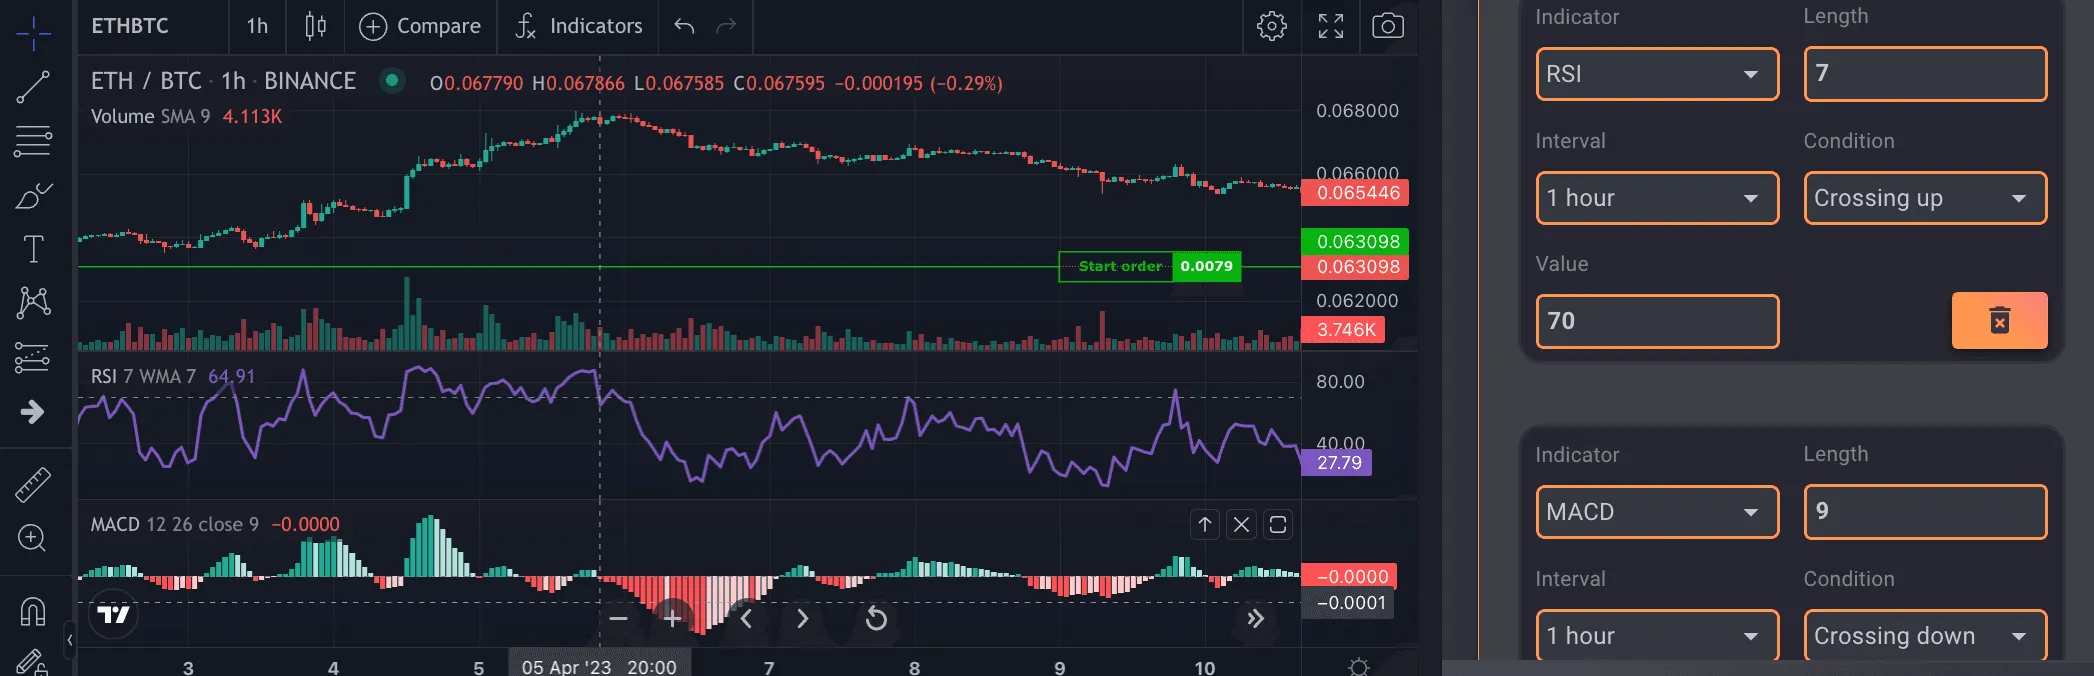 Sell Signal
Conclusion#
The Relative Strength Index (RSI) is a powerful and versatile technical indicator that can provide valuable insights for cryptocurrency traders. Combining these strategies with proper risk management techniques is crucial to protect your portfolio and maximizing profitability.