Stochastic
In this article, we explain what is the Stochastic indicator and how it can be used in bot trading.
TL;DR
The Stochastic Oscillator measures price momentum using K and D lines oscillating between 0-100, with readings above 80 indicating overbought and below 20 indicating oversold conditions. It''s best suited for sideways markets and can be used for crossover and divergence detection.
In the fast-paced cryptocurrency trading world, traders are continually looking for effective tools and strategies to gain an edge in the market. One such tool is the Stochastic indicator, a widely-used technical indicator that can help identify potential entry and exit points in a trade. In this article, we'll explore the basics of RSI, and how it can be applied to bot strategies to help you maximize your profits.
The Stochastic Indicator#
George Lane created the Stochastic Oscillator indicator in the late 1950s. Lane was a technical analyst and trader who developed the indicator to measure the momentum of price movements. The Stochastic Oscillator is now one of the most popular technical indicators traders use worldwide.
The Stochastic indicator is used to measure the momentum of a financial asset's price. It compares the asset's closing price to its price range over a set period of time, typically 14 periods, and provides signals of potential price reversal points based on oversold or overbought conditions. The indicator is based on the assumption that as prices increase, the closing price tends to be closer to the high price, and as prices decrease, the closing price tends to be closer to the low price.
The indicator consists of two lines, K and D, which oscillate between 0 and 100. The K line represents the current closing price relative to the price range over a set period, while the D line is a moving average of the K line. When the K line crosses above the D line, it indicates that the price may continue to rise. Conversely, when the K line crosses below the D line, it indicates that the price may continue to fall (you can see the two lines in the image below)
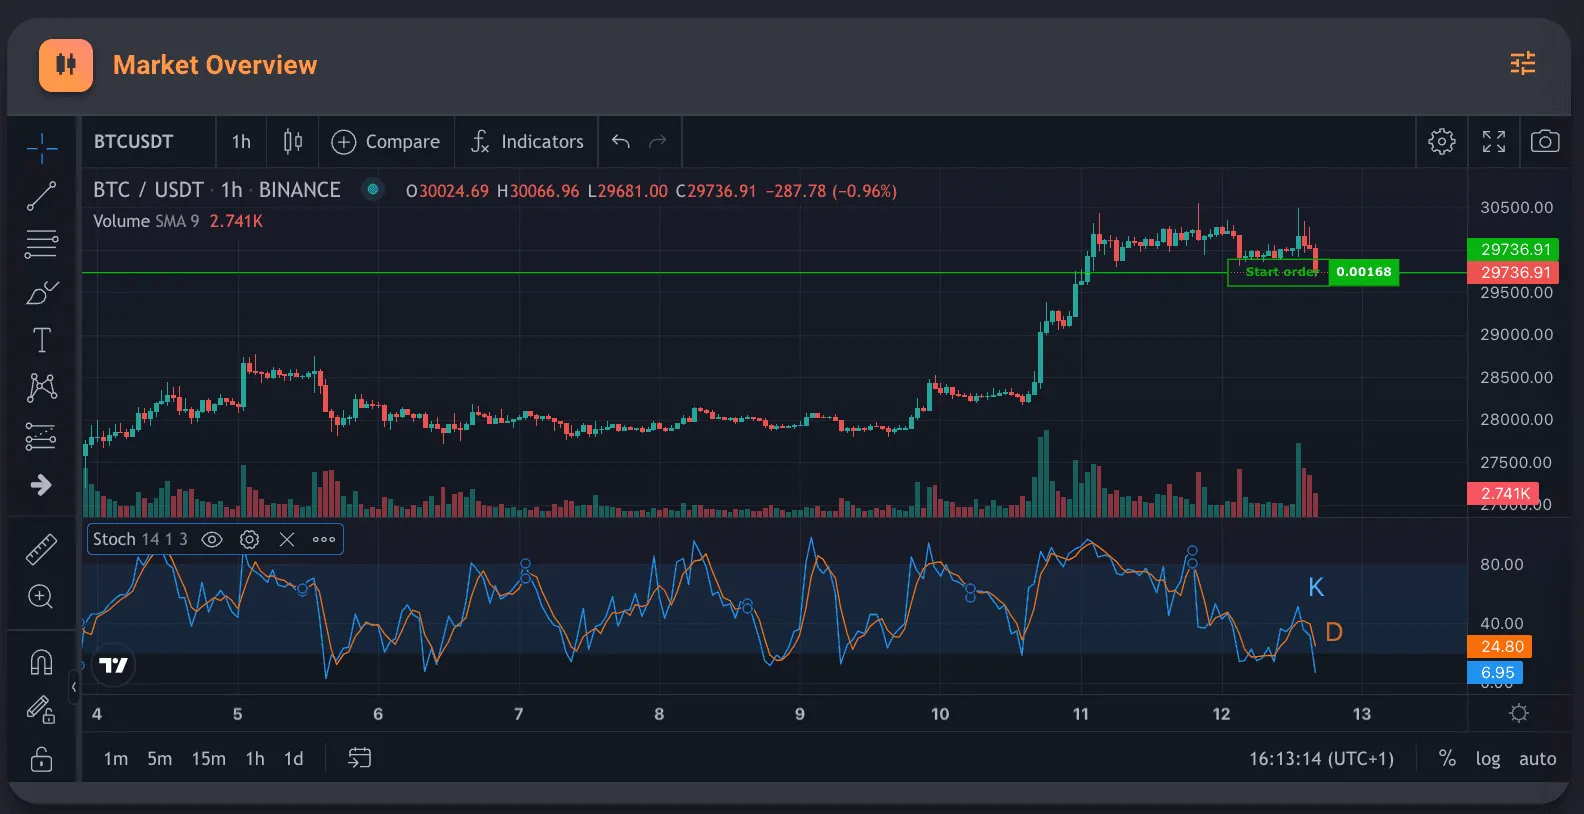 K and D oscillators
This indicator is very similar to RSI. RSI is more suitable for trending markets, while Stoch is best during a sideway market.
Using Stochastic RSI in Gainium#
You can select this indicator by selecting “Technical Indicators” from the drop-down menu first, then “Stoch” in the “Indicator” Section.
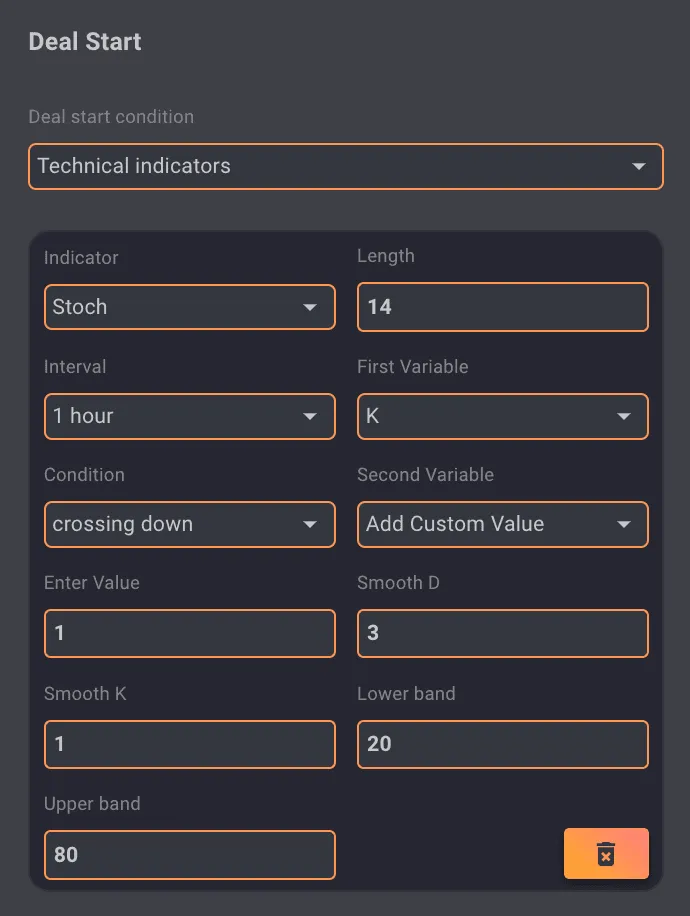 Stochastic
Implementing Stochastic in Your Trading Bot Strategy#
Identifying overbought and oversold levels#
Traders often use the Stochastic indicator to identify potential overbought and oversold conditions in an asset's price. When the indicator is above 80, the asset is overbought; when the value is below 20, it is oversold. Traders may look for potential buying opportunities when the indicator is oversold and potential selling opportunities when it is overbought. In the image below, you can see how the price reacts after the indicator crosses up 20 or crosses down 80.
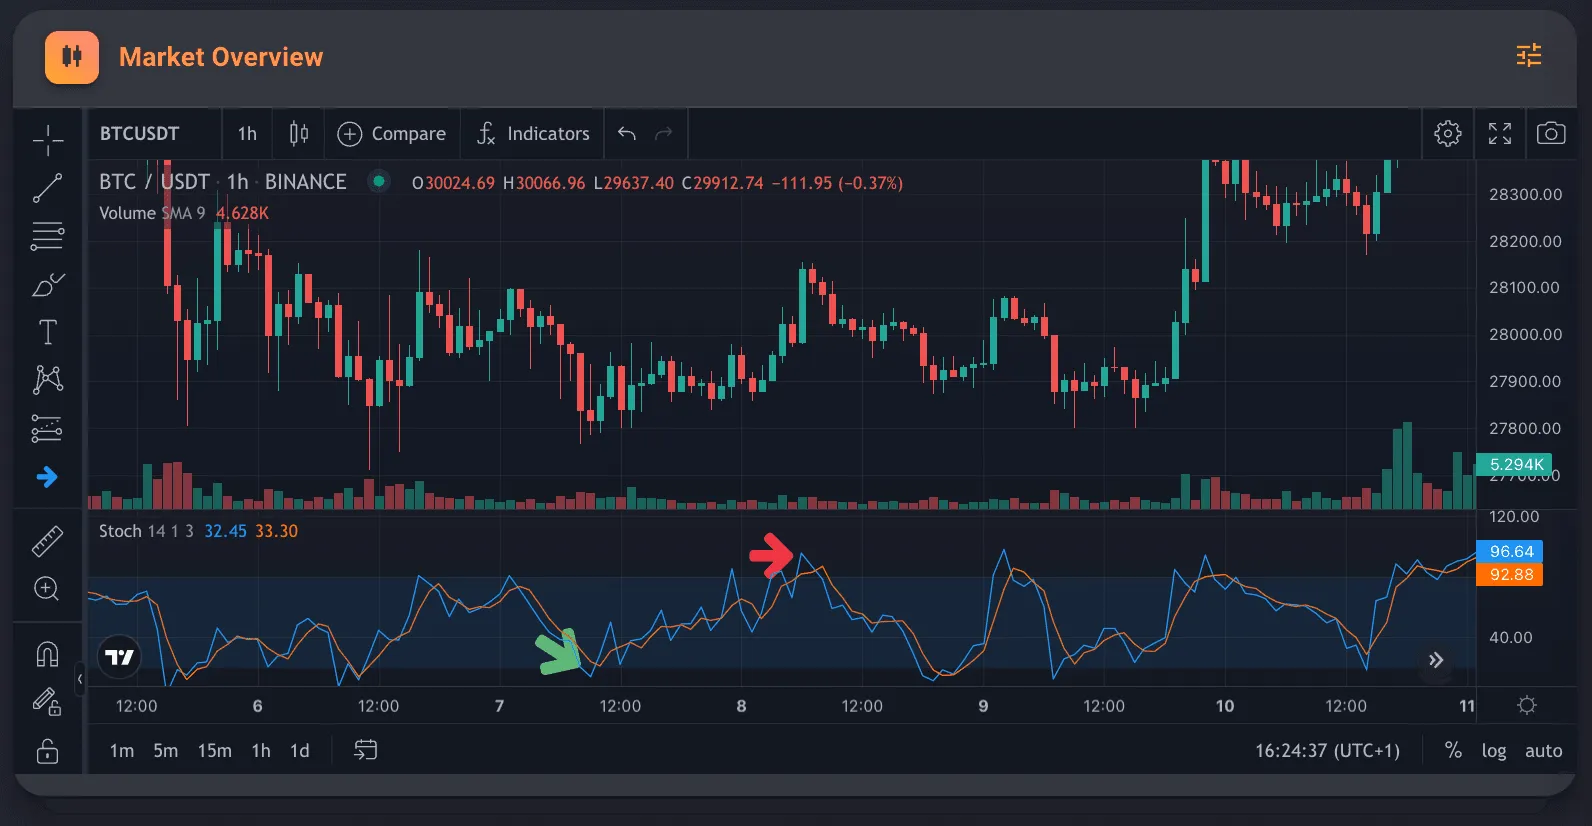 Buy and Sell Signals
Crossovers#
Traders may also look for crosses between the K and D lines of the Stochastic indicator. For example, a bullish signal may be generated when the K line crosses above the D line, indicating that the momentum of the price is shifting upward. So you might want to start a long DCA bot when the K variable is crossing up D or start a short DCA or take profit when the K variable is crossing down D. You can see how the price reacts after the variables also cross in the image above when we talk about Overbought and Oversold Levels.
Divergencies#
Traders may also use the Stochastic indicator to identify potential divergences between the indicator and the price of an asset. For example, if an asset's price is making higher highs while the Stochastic indicator is making lower highs, it may indicate that the price will soon reverse course and begin to fall. Divergencies are pretty powerful, especially in larger timeframes. As you can see in the image below, the price decreases quite soon after the divergence occurs.
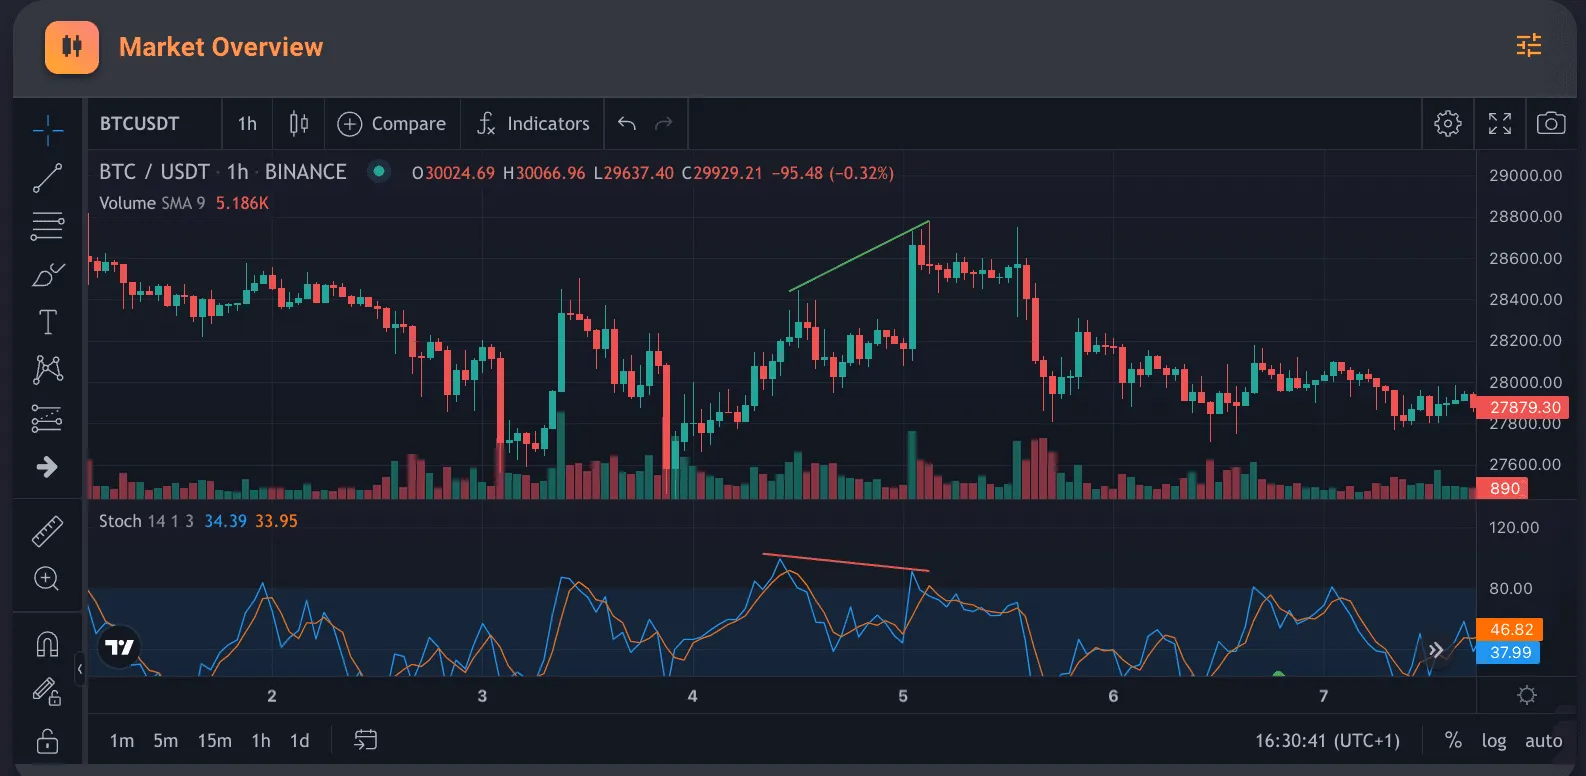 DIvergencies
Conclusion#
The Stochastic indicator is best used in conjunction with other indicators for confirmation. This indicator can generate false signals, particularly in a trending market, and it can give different signals depending on the time frame used. Gainium offers a great backtesting tool: testing and fine-tuning the parameters to suit your risk tolerance and market conditions is essential.