Williams Percent Range
Learn how to use the Williams %R indicator in Gainium for automated trading, detecting trends, reversals, and overbought/oversold conditions with detailed strategy examples.
TL;DR
Williams %R is a momentum oscillator ranging from 0 to -100 that identifies overbought (above -20) and oversold (below -80) conditions. In Gainium, it can be configured for automated reversal trading or trend-following strategies using mid-range thresholds.
The Williams %R indicator is a momentum-based oscillator that measures overbought and oversold market conditions. It ranges from 0 to -100, with values above -20 signaling overbought conditions and values below -80 indicating oversold conditions. This tool is handy for identifying potential reversals and momentum shifts in price movements.
In this article, we will define the Williams %R indicator, explain how to configure it in Gainium, and show how it can be used effectively in automated bot trading. We’ll also provide examples of trading strategies with detailed entry and exit rules, practical considerations, and a conclusion on using Williams %R in your trading strategies.
What is Williams %R?#
The Williams %R (Williams Percent Range) oscillator measures the current price relative to the high and low of a specific lookback period, typically 14. It is essentially a reversal of the Stochastic Oscillator and helps traders identify overbought or oversold conditions.
- Overbought Conditions: When Williams %R is above -20.
- Oversold Conditions: When Williams %R is below -80.
Key Features:#
- Range: 0 to -100, with overbought and oversold levels at -20 and -80, respectively.
- Momentum Indicator: Helps identify market momentum shifts and potential trend reversals.
How to Configure Williams %R in Gainium#
Here’s how to configure the Williams %R indicator in Gainium.
Step 1: Add the Williams %R Indicator#
- Navigate to the Bot Settings:Log in to Gainium, select your bot, and find Williams %R in the list of available indicators.
Step 2: Configure the Indicator Settings#
- Length: Set the length to 14, the standard period for calculating Williams %R. This defines how far back the price data is used to calculate the overbought or oversold levels.
- Interval: Choose the time interval for each calculation. The image below is set to 1 day, meaning the Williams %R will be calculated based on daily price movements. Shorter intervals (e.g., 1 hour) can provide more frequent signals, while longer intervals (e.g., daily) capture larger trends.
- Condition: Select the condition to trigger trades. Crossing Down is chosen in this case, which means the bot will trigger an action when the Williams %R crosses below a certain value (in this example, -40).
- Value: Set the value at which the bot should trigger trades. Here, it's set to -40, signaling the price is moving downward, but not yet in an oversold region.
- Keep True: This setting determines how long the condition remains active after being triggered. A value of 0 means it resets immediately after the condition is met.
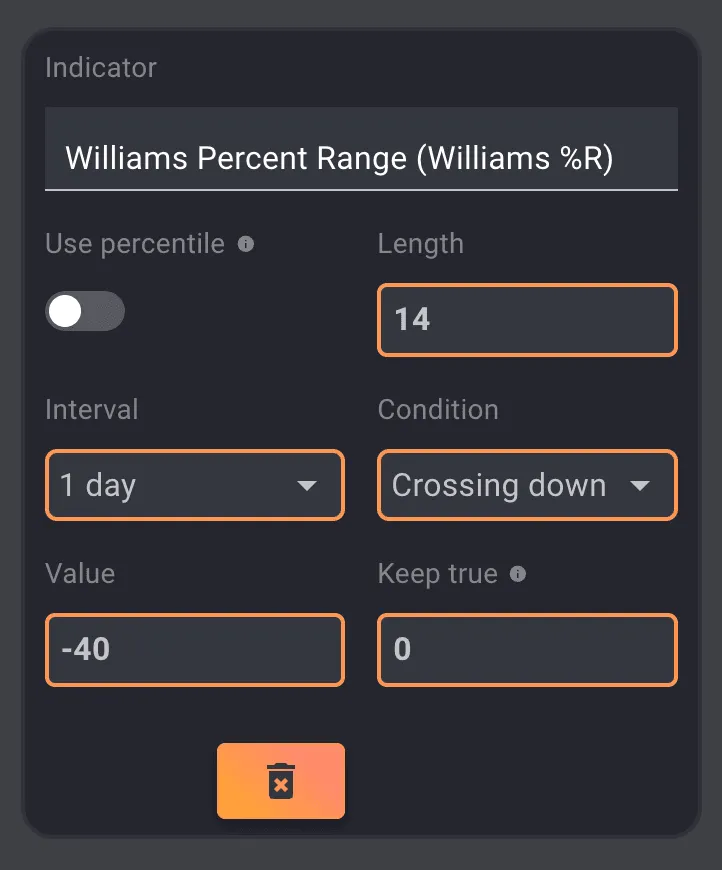 Williams %R Indicator Settings
Step 3: Positive and Negative Percent Changes#
- Positive % Change: Detects price increases. If the Williams %R rises above a specific level (e.g., -40 to -20), it indicates increasing bullish momentum.
- Negative % Change: Detects price decreases. If the Williams %R falls below a certain level (e.g., -40 to -80), it signals bearish momentum.
Using Williams %R in Bot Trading#
The Williams %R indicator can be effectively integrated into bot trading to identify reversal points and capitalize on market trends. Here are two example strategies that utilize the Williams %R in Gainium.
Strategy 1: Reversal Trading Strategy#
Entry Rules
- Long Entry (Buy):Enter a long position when Williams %R crosses below -80 and then crosses back above -80, signaling oversold conditions and a potential upward reversal.
- Short Entry (Sell):Enter a short position when Williams %R crosses above -20 and then crosses below -20, signaling overbought conditions and a potential downward reversal.
Exit Rules
- Long Exit:Exit the long trade when Williams %R crosses back above -20, signaling that the price may be overbought and a reversal is likely.
- Short Exit:Exit the short trade when Williams %R crosses back below -80, signaling that the price may be oversold and a reversal is likely.
Implementation in Gainium
- Configure the Williams %R Indicator:Set the Length to 14 and the Interval to 1 day. Configure the bot to trigger when Williams %R crosses key overbought or oversold levels (-20 and -80).
- Automate Entries and Exits:Program the bot to enter trades when Williams %R crosses into oversold or overbought conditions and exit trades when the opposite condition is triggered.
Strategy 2: Trend Following Strategy#
Entry Rules
- Long Entry (Buy):Enter a long position when Williams %R crosses above -40 after rising from below, indicating a bullish trend.
- Short Entry (Sell):Enter a short position when Williams %R crosses below -60 after falling from above, signaling a bearish trend.
Exit Rules
- Long Exit:Exit the trade when Williams %R crosses below -60, indicating the bullish momentum may be weakening.
- Short Exit:Exit the trade when Williams %R crosses above -40, signaling the bearish trend may be reversing.
Implementation in Gainium
- Set the Thresholds:Configure the bot to enter trades when Williams %R crosses key thresholds, like -40 for long trades and -60 for short trades.
- Risk Management:Incorporate stop-losses to protect against unexpected market movements and set profit targets to lock in gains when the market moves in your favor.
Practical Considerations#
Here are some key considerations when using the Williams %R indicator in your trading strategy:
1. Sensitivity to Price Movements#
- Shorter lengths (e.g., 10 periods) will react more quickly to price changes but may produce more false signals. Longer lengths (e.g., 20 or 30 periods) smooth out the signals but might lag behind market trends.
2. Combining with Other Indicators#
- Combine Williams %R with other momentum or trend indicators like moving averages or RSI to confirm signals. This reduces the likelihood of false entries and improves overall trading performance.
3. Timeframe Adjustments#
- Using shorter intervals (e.g., 1 hour) will provide more frequent signals, while longer intervals (e.g., daily) help capture larger, more sustained price movements.
4. Backtest Before Going Live#
- Always backtest your strategies using historical data before live trading. Gainium’s backtesting feature allows you to evaluate how well the Williams %R performs under different market conditions.
Conclusion#
The Williams %R indicator is a powerful tool for identifying overbought and oversold conditions and trend reversals. By configuring it in Gainium, you can automate entry and exit points for your trading strategies based on momentum shifts. Whether you’re employing a reversal strategy or a trend-following approach, Williams %R provides a flexible and effective way to capture market opportunities.
With proper configuration, backtesting, and risk management, Williams %R can become a valuable part of your automated trading strategy in Gainium.