Bollinger Band Width (BBW)
In this article, we explain what is BBW indicator and how it can be used in bot trading.
TL;DR
Bollinger Band Width (BBW) measures the distance between the upper and lower Bollinger Bands, indicating market volatility. High BBW values signal high volatility (potential reversals), low values signal consolidation (potential breakouts), and it is non-directional so should be combined with other indicators.
As the popularity of cryptocurrency trading continues to grow, so does the interest in trading automation. Trading bots can streamline the investment process by minimizing human error and capitalizing on market opportunities more effectively. One versatile technical indicator that can greatly enhance your trading bot's performance is the Bollinger Band Width (BBW). In this article, we'll explore how to effectively use the BBW indicator in your automated trading strategy.
Understanding the BBW Indicator#
The BBW, developed by John Bollinger in the 1980s, is a technical indicator that measures the distance between the upper and lower Bollinger Bands. The Bollinger Bands are composed of three lines: a Simple Moving Average (SMA) and two lines plotted at a specified number of standard deviations above and below the SMA. The BBW indicator helps traders identify periods of high volatility and potential price reversals by measuring the relative width of the bands.
BBW = (Upper Bollinger Band - Lower Bollinger Band) / Middle Bollinger Band
During periods of high volatility, the distance between the Lower and Upper Bollinger Bands is wider, eventually indicating the end of a move. During periods of low volatility, the distance between the bands will reduce; hence the value of BBV is closer to zero. Extended periods of very low volatility are followed by a sudden surge known as the Squeeze.
This indicator is non-directional, which means it only registers the strength of the trend rather than its direction. As a result, it should be used in conjunction with other indicators.
Using BBW in Gainium#
You can select this indicator by selecting “Technical Indicators” from the drop-down menu first, then “BBW” in the “Indicator” Section.
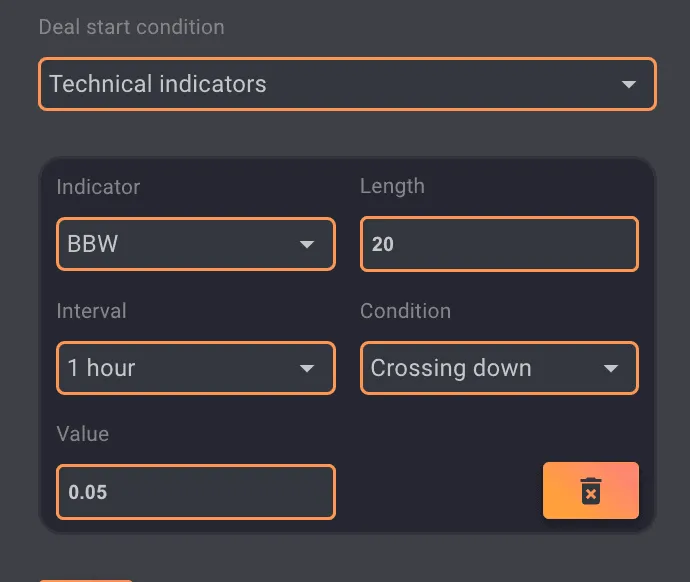 BBW indicator
How to incorporate BBW in your bot trading#
A. BBW Volatility Breakout Strategy#
In a volatility breakout strategy, your trading bot will capitalize on significant price movements following periods of low volatility. When the BBW value is low, it indicates a potential breakout as the bands are narrow. Your bot can initiate a long position when the price breaks above the upper Bollinger Band or a short position when it breaks below the lower Bollinger Band.
For example, in the image below, when BBW is very low (I have drawn a line to visualize when BBW is below 0.0183) and RSI is oversold (below 30), it could indicate a potential strong downtrend move of the price. Conversely, when the BBW is low and the RSI is above 70 the price is likely to drop.
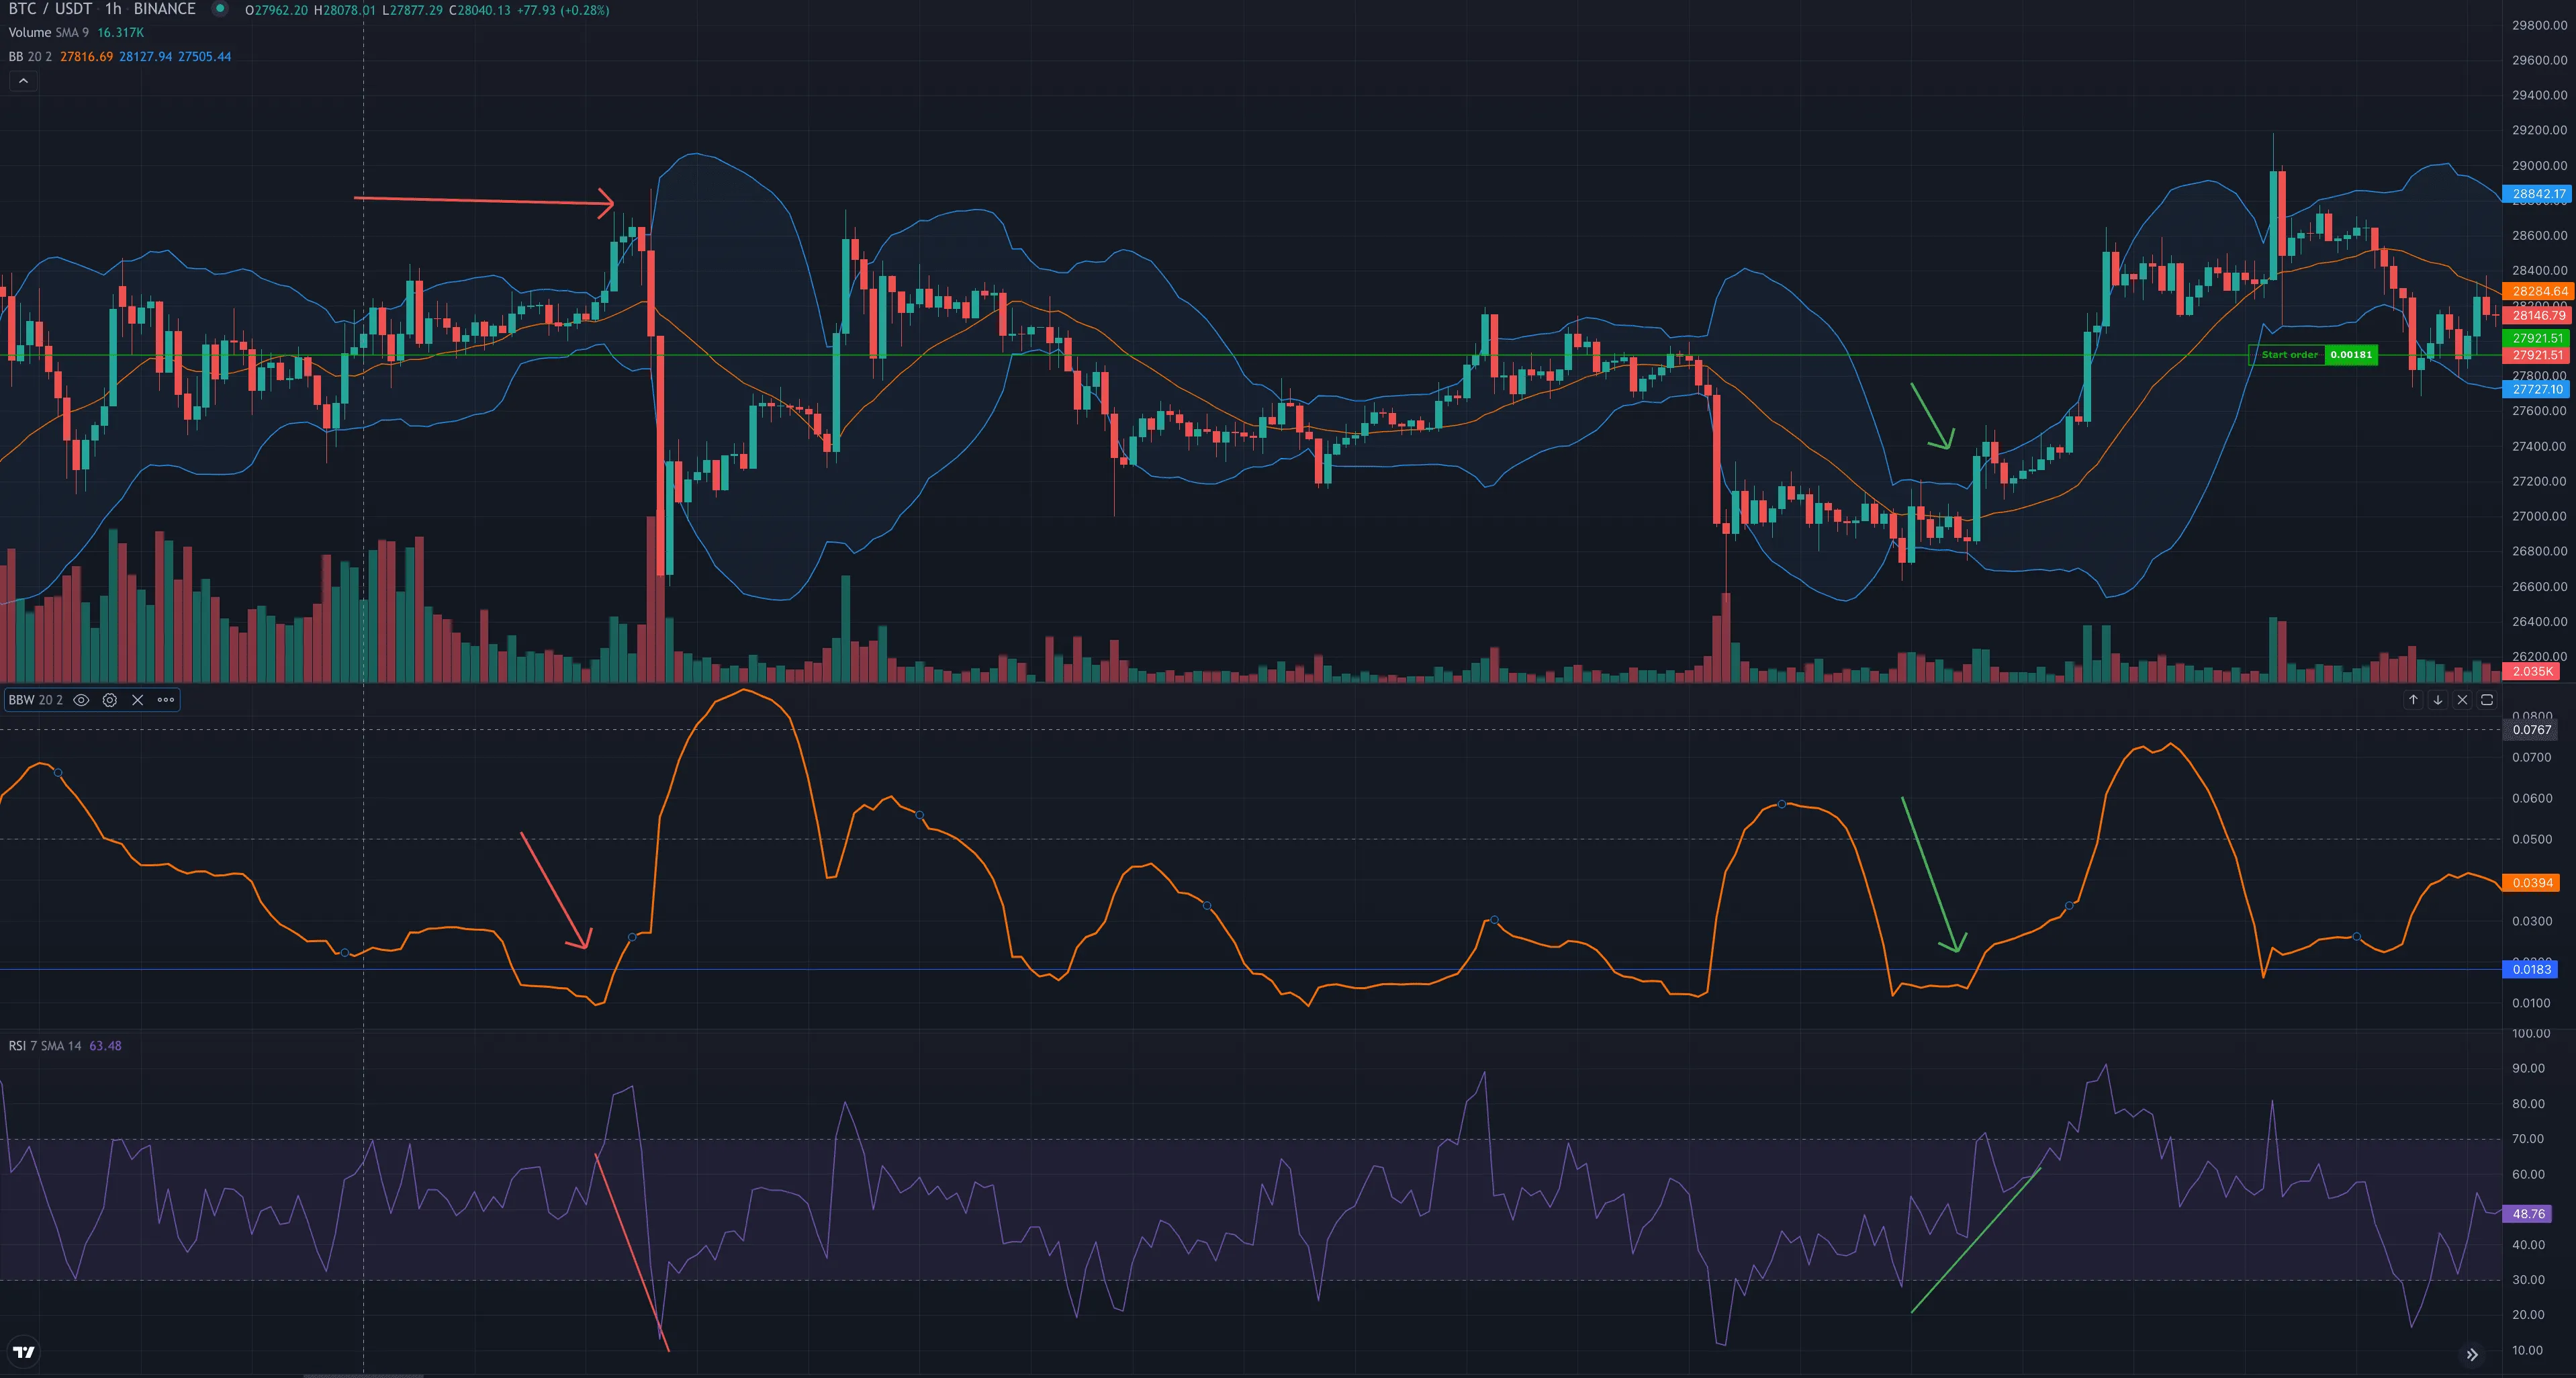 BBW and RSI
B. BBW Mean Reversion Strategy#
In a mean reversion strategy, your trading bot will take advantage of price fluctuations by buying low and selling high within the Bollinger Bands. When the BBW value is high, indicating a volatile market, your bot can initiate a long position when the price touches the lower Bollinger Band and a short position when it touches the upper Bollinger Band.
For instance, when the BTC/USDT pair has a high BBW value and the price reaches the lower Bollinger Band, the bot can initiate a long position, expecting the price to revert to the mean (SMA). Conversely, when the price reaches the upper Bollinger Band, the bot can exit the position or initiate a short trade.
C. BBW Squeeze Strategy#
The squeeze strategy aims to identify potential price breakouts following periods of consolidation. When the BBW value decreases and the bands contract, it can signal a potential breakout in either direction. Your trading bot can monitor for additional technical indicators, such as a spike in trading volume or a break of a trendline, to confirm the breakout direction before initiating a trade.
Using the BTC/USDT pair as an example, if the BBW value decreases and the bands contract, your bot can monitor for additional confirmation signals, such as a significant increase in trading volume. If the price breaks above the upper Bollinger Band and trading volume surges, the bot can initiate a long position, anticipating a bullish breakout. The bot will then hold the position until the price reverses or reaches a predetermined profit target.
Conclusion#
The Bollinger Band Width indicator can provide valuable insights into market volatility and potential trading opportunities for your crypto trading bot. You can optimize your automated trading system and enhance your investment returns by understanding and implementing the BBW volatility breakout, mean reversion, and squeeze strategies. As with any trading strategy, testing and fine-tuning the parameters to suit your risk tolerance and market conditions is essential. Combining the BBW with other technical indicators and fundamental analysis can further improve the effectiveness of your trading bot and contribute to a well-rounded trading strategy.