Bollinger Bands (BB)
In this article, we explain what is the Bollinger Bands indicator and how it can be used in bot trading.
TL;DR
Bollinger Bands (BB) consist of a Simple Moving Average with upper and lower bands at 2 standard deviations, helping identify overbought/oversold conditions and volatility. In Gainium bots, they can be used for breakout strategies, mean reversion (buying at lower band, selling at upper), and squeeze strategies.
The rise of cryptocurrency trading has led to a surge in the adoption of trading automation. Trading bots have become an invaluable tool for investors to minimize human error and capitalize on market opportunities more efficiently. One popular technical indicator that can significantly enhance your trading bot's performance is the Bollinger Bands (BB). In this article, we'll discuss how to effectively use the Bollinger Bands indicator in your automated trading strategy.
Understanding the Bollinger Bands Indicator#
The Bollinger Bands, developed by John Bollinger in the 1980s, is a volatility-based technical indicator that consists of three lines: a Simple Moving Average (SMA), an upper band, and a lower band. The upper and lower bands are plotted at a specified number of standard deviations (typically 2) above and below the SMA. Bollinger Bands help traders identify potential price reversals and gauge market volatility by measuring the relative width of the bands (see also the Bollinger Bands Width).
Bollinger Bands is one of the most popular indicators used for bot trading (together with RSI) because of its straightforward setup.
The bands expand when the price is volatile and contract when the price lacks volatility. When the price touches the upper Bollinger Band, it can indicate an overbought or sell signal, and if the price touches the lower band, it can mean an oversold or buy signal.
As mentioned in the BBW indicator, when the Upper and Lower bands are very close, the volatility decreases there is a higher chance of a substantial increase in price volatility. Traders call this trading opportunity the “Squeeze.”
Using the Bollinger Bands Indicator in Gainium#
You can select this indicator by selecting “Technical Indicators” from the drop-down menu first, then “Bollinger Bands” in the “Indicator” Section.
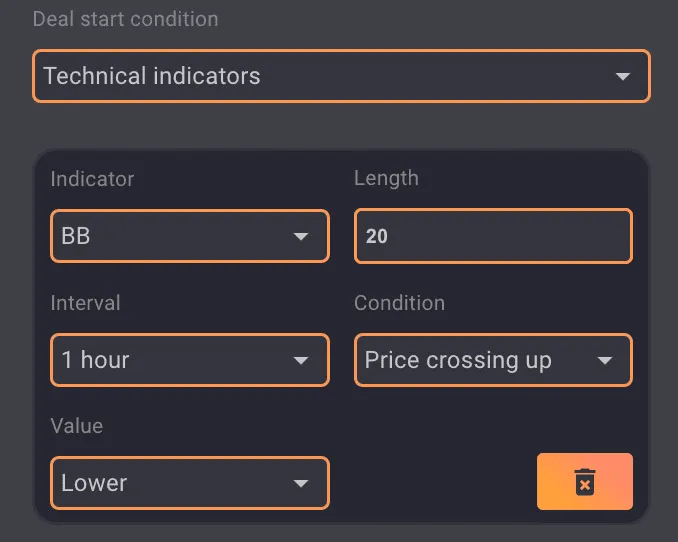 Bollinger Bands
Examples of BBW Strategies for bot trading#
A. Bollinger Bands Breakout Strategy
In a breakout strategy, your trading bot will capitalize on significant price movements following periods of consolidation. When the price breaks above the upper Bollinger Band, it can signal a bullish breakout, prompting your bot to initiate a long position. Conversely, when the price breaks below the lower Bollinger Band, it can signal a bearish breakout, leading the bot to enter a short position.
For example, if the BTC/USDT pair's price breaks under the lower Bollinger Band, your bot will initiate a short position, anticipating a bearish trend. The bot will then hold the position until the price reverses or reaches a predetermined profit target.
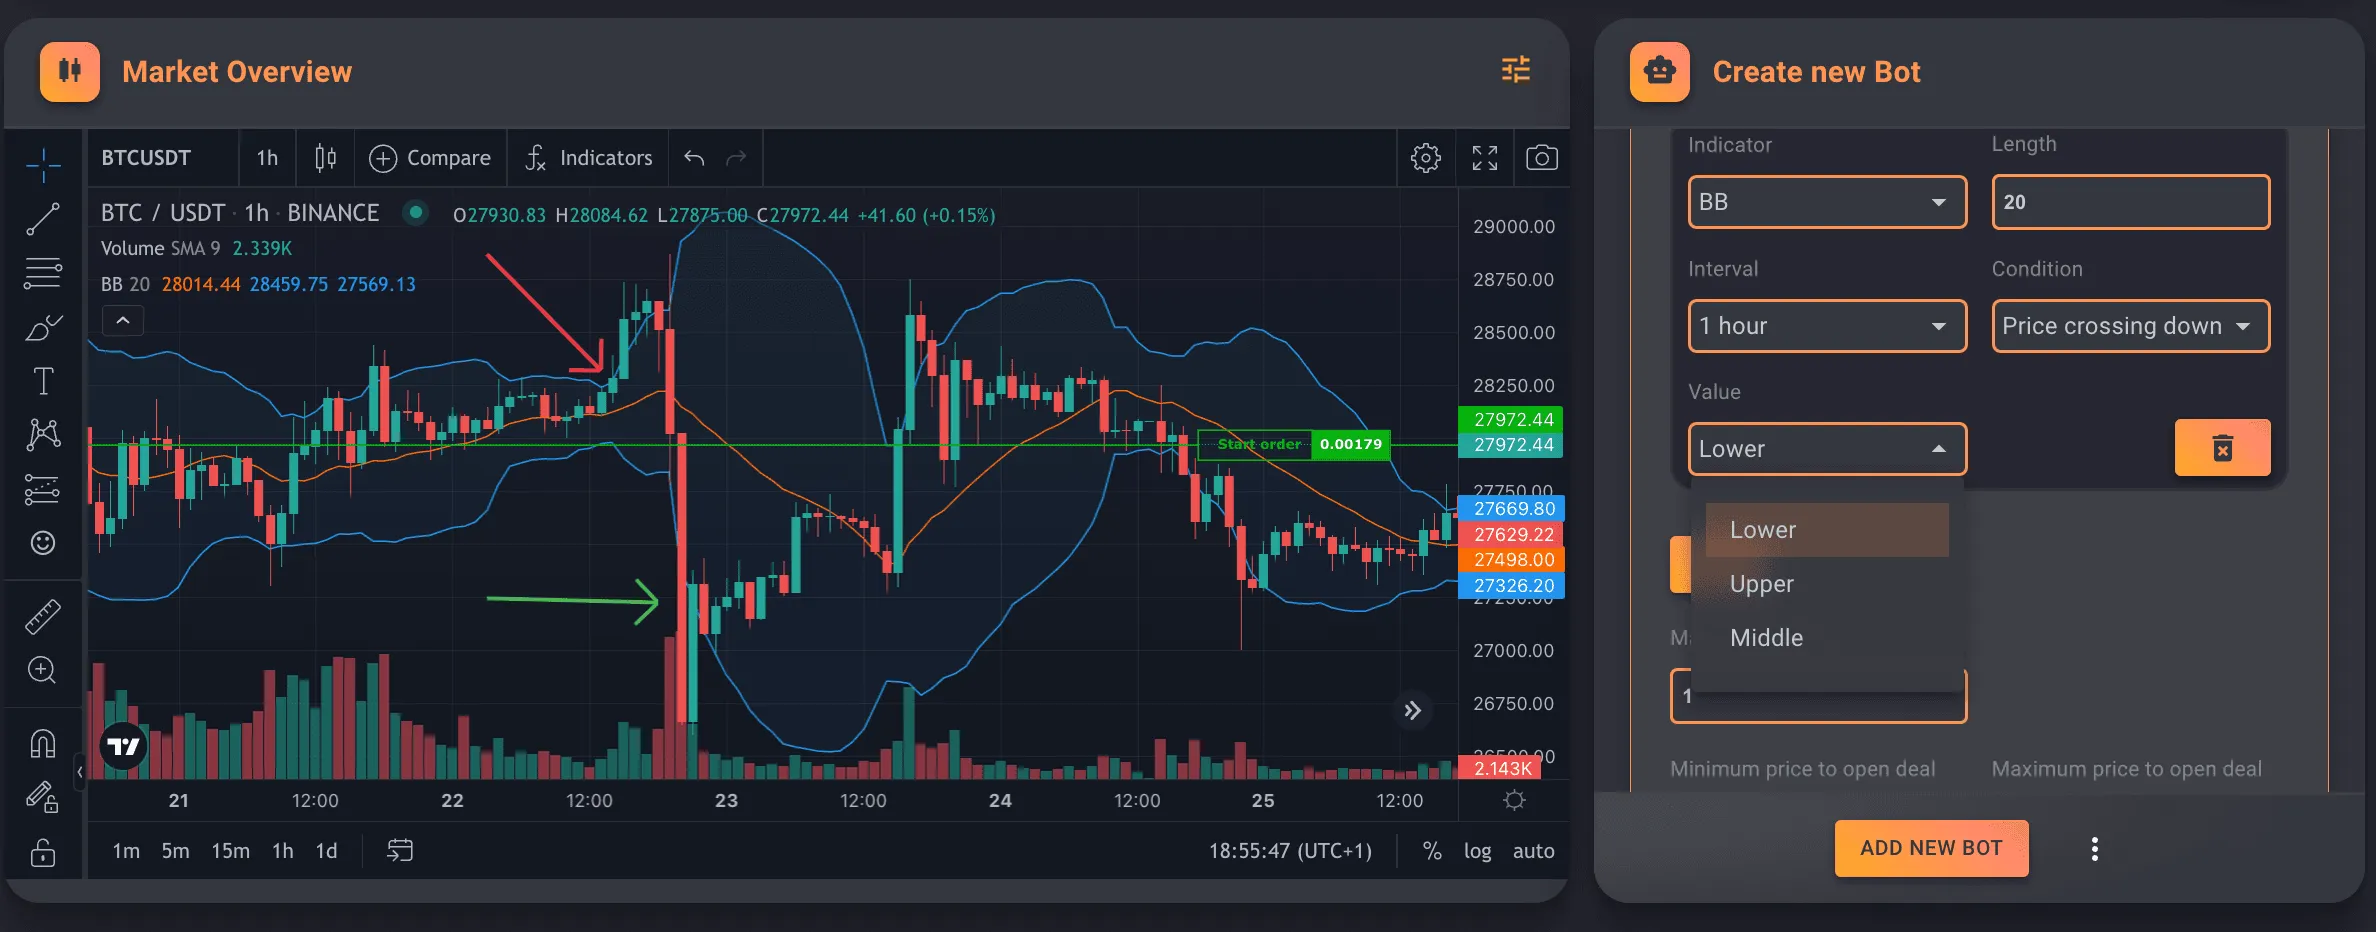 Bollinger Bands buy and sell signals
B. Bollinger Bands Mean Reversion Strategy
In a mean reversion strategy, your trading bot will take advantage of price fluctuations by buying low and selling high within the Bollinger Bands. When the price touches the lower Bollinger Band, your bot can initiate a long position, expecting the price to revert to the mean (SMA). Conversely, when the price touches the upper Bollinger Band, the bot can exit the position or initiate a short trade.
For instance, when the BTC/USDT pair's price reaches the lower Bollinger Band, the bot can initiate a long position, anticipating an upward price movement toward the SMA. The bot can exit the position or enter a short trade when the price reaches the upper Bollinger Band.
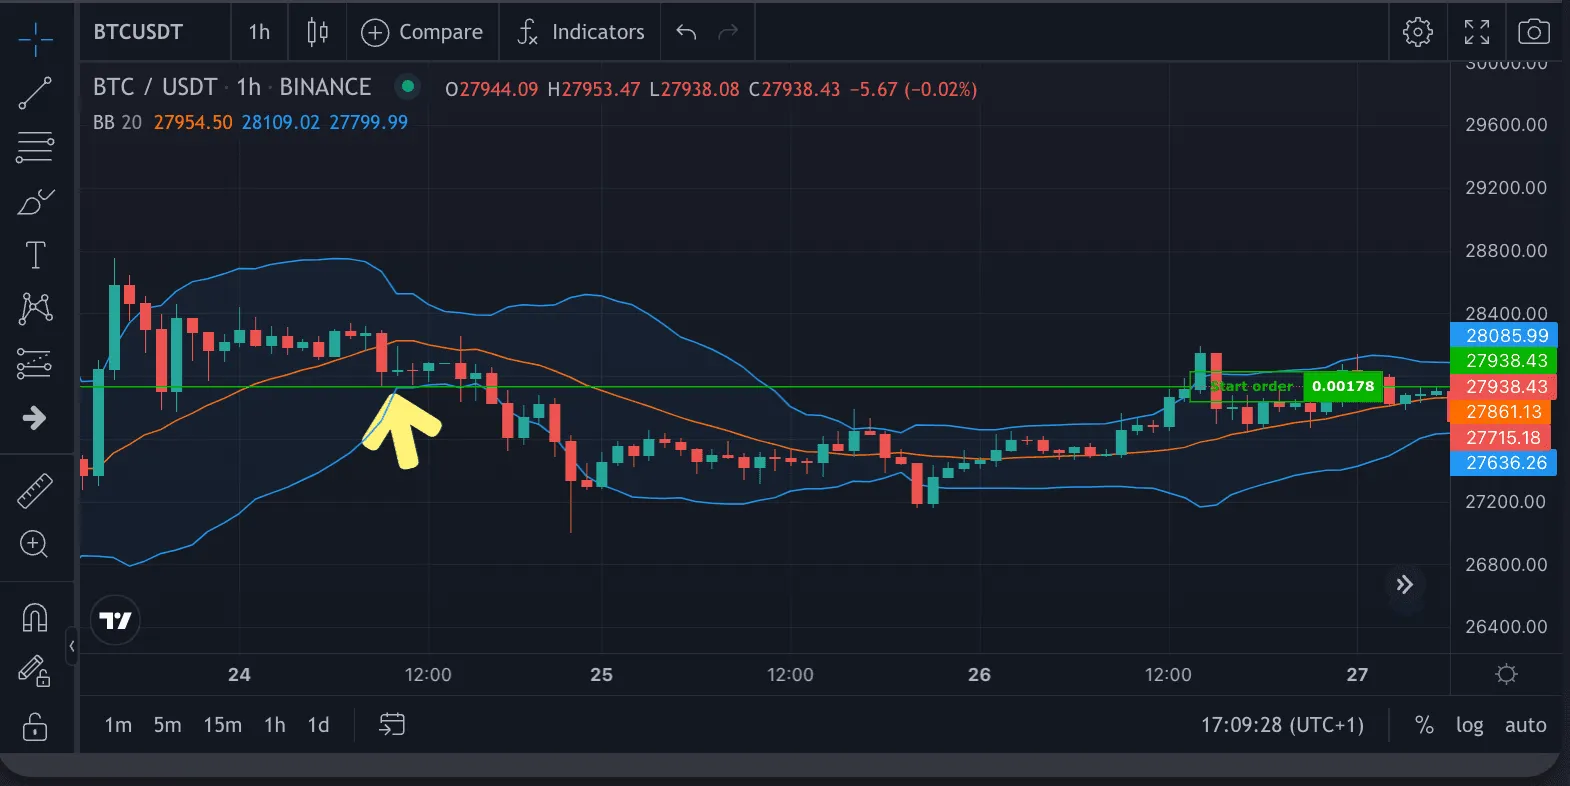 Trend reversal
C. Bollinger Bands Squeeze Strategy
The squeeze strategy aims to identify potential price breakouts following periods of consolidation. When the Bollinger Bands contract and the bands' width narrows, it can signal a potential breakout in either direction. Your trading bot can monitor additional technical indicators, such as a spike in trading volume or a break of a trendline, to confirm the breakout direction before initiating a trade.
Using the BTC/USDT pair as an example, if the Bollinger Bands contract and the width narrows, your bot can monitor additional confirmation signals, such as a significant increase in trading volume. If the price breaks above the upper Bollinger Band and trading volume surges, the bot can initiate a long position, anticipating a bullish breakout. The bot will then hold the position until the price reverses or reaches a predetermined profit target.
 The Squeeze
Practical considerations when using Bollinger Bands in Bot Trading#
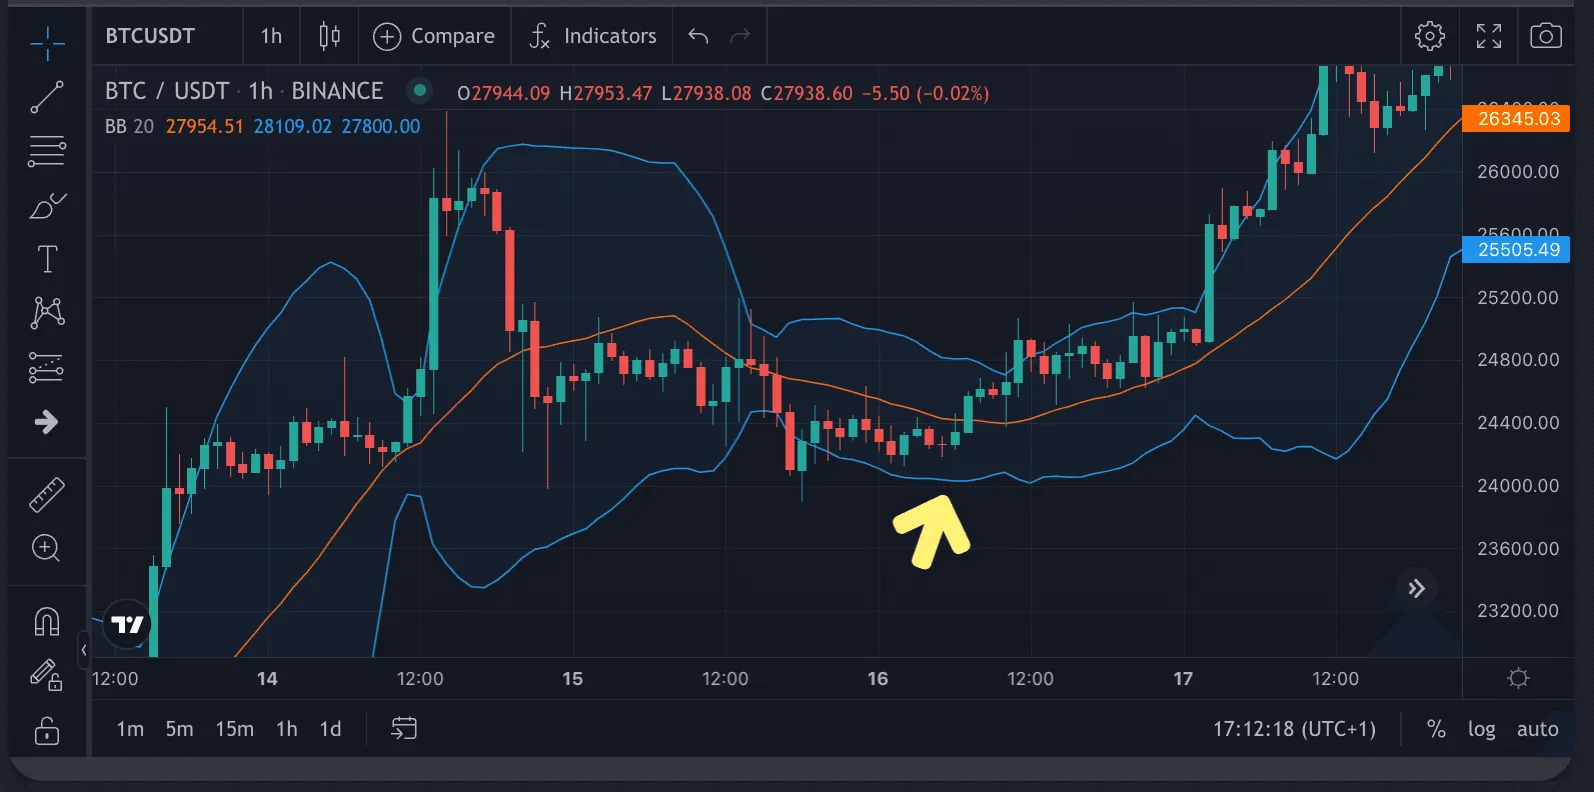
Traders can also use Bollinger Bands across multiple timeframes to confirm trends and generate trading signals. For example, if the price is above the lower Bollinger Band on the daily chart and the 1-hour chart there is a squeeze, which indicates a strong uptrend, it may be an excellent time to enter a long position. In the example below, the price finds support on the daily timeframe, indicating that the squeeze occurring in a 1-hour timeframe might lead to an upward move.
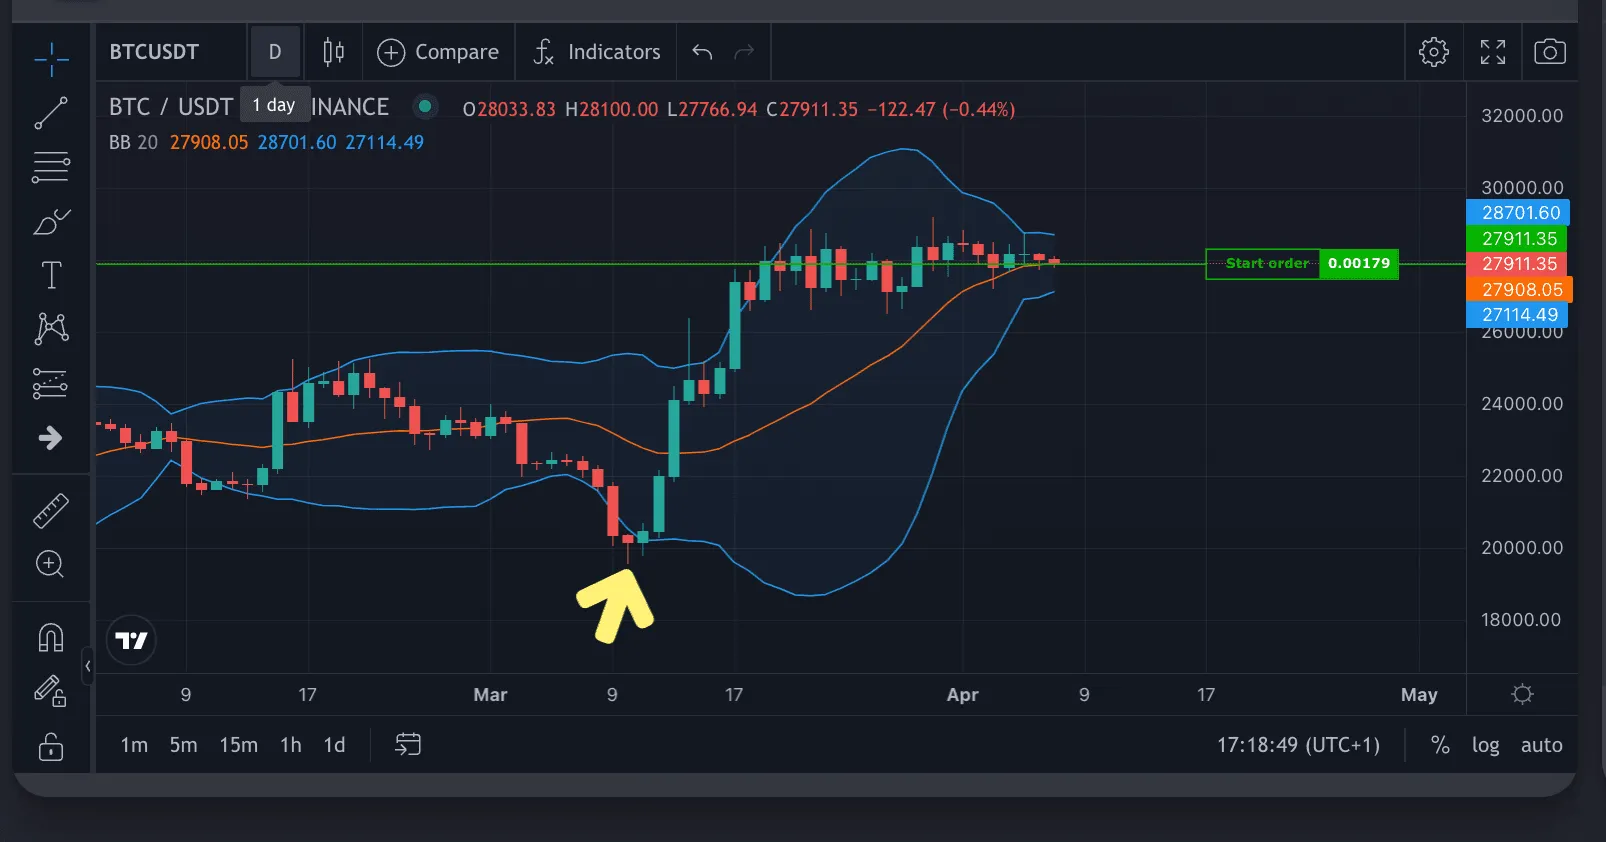 Price support on daily on the lower band
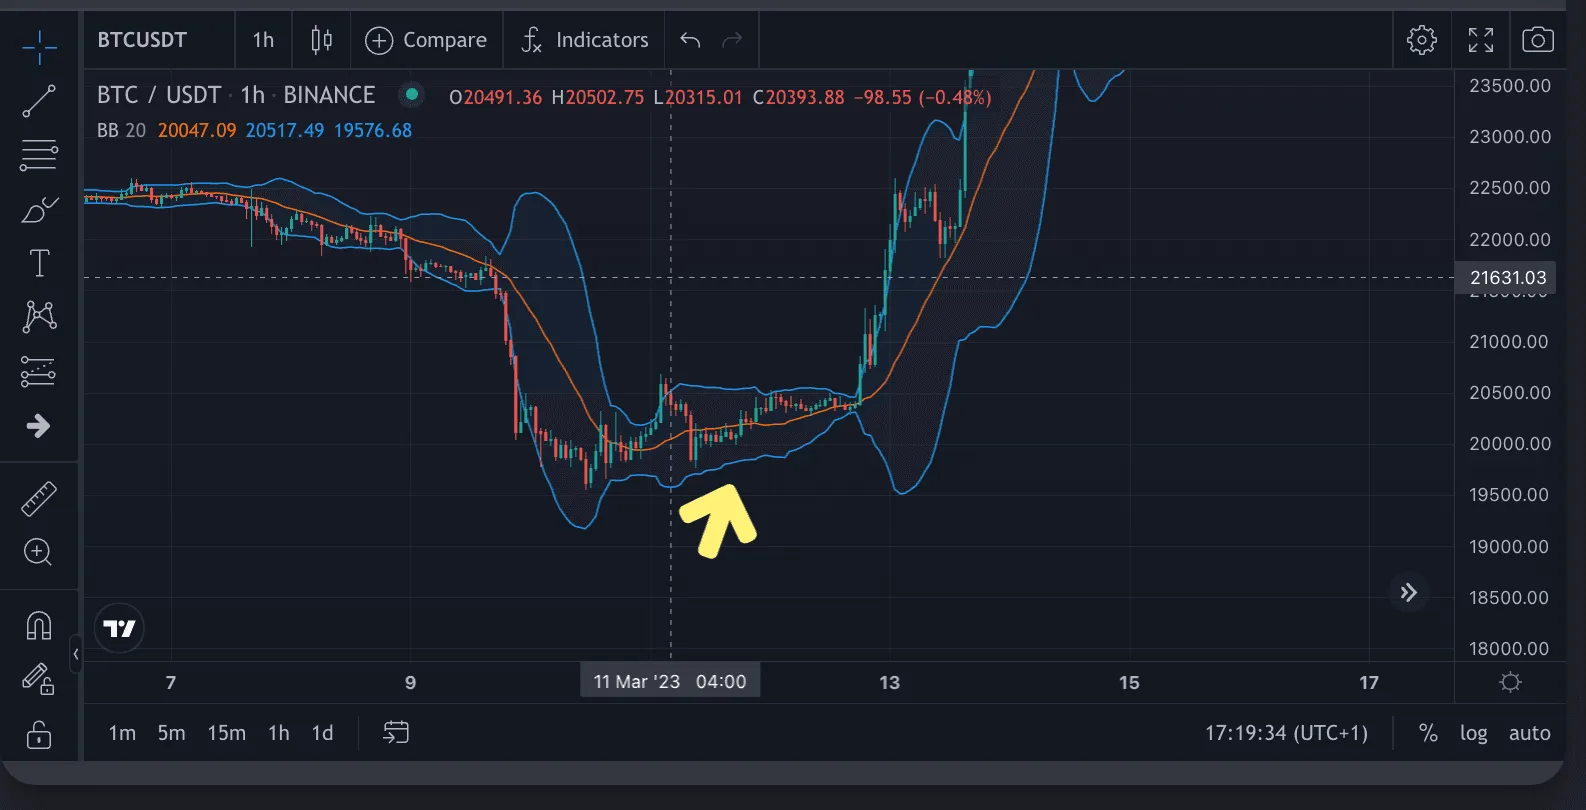 Squeeze in 1 hour
Conclusion#
The Bollinger Bands indicator can provide valuable insights into market volatility and potential trading opportunities for your crypto trading bot. As with any trading strategy, testing and fine-tuning the parameters to suit your risk tolerance and market conditions is essential. Combining the Bollinger Bands with other technical indicators and fundamental analysis can further improve the effectiveness of your trading bot and contribute to a well-rounded investment approach.