Stochastic RSI
In this article, we explain what is the Stoch RSI indicator and how it can be used in bot trading.
TL;DR
The Stochastic RSI combines the RSI and Stochastic oscillator into a more sensitive momentum indicator suited for short-term trading. It can be used for overbought/oversold detection, K/D crossover signals, and divergence identification.
Traders continually seek practical tools and strategies to gain an edge in the market. One such tool is the Stochastic RSI Indicator, a widely-used technical indicator that can help identify potential entry and exit points in a trade based on momentum price. In this article, we'll explore the basics of the indicator and how it can be applied to help you maximize your profits.
The Stochastic RSI Indicator (stoch rsi)#
The Stochastic RSI (Relative Strength Index) indicator is a technical analysis tool used to measure the momentum of an asset's price. It is based on the traditional RSI indicator but adds the Stochastic oscillator's sensitivity to price movements. The Stochastic RSI combines two popular indicators to create a more sensitive indicator better suited for short-term trading. You can learn more about the stochastic oscillator formula and RSI in these other articles: Stochastic, and RSI.
Using Stochastic RSI in Gainium#
You can select this indicator by selecting “Technical Indicators” from the drop-down menu first then “StochRSI” in the “Indicator” Section.
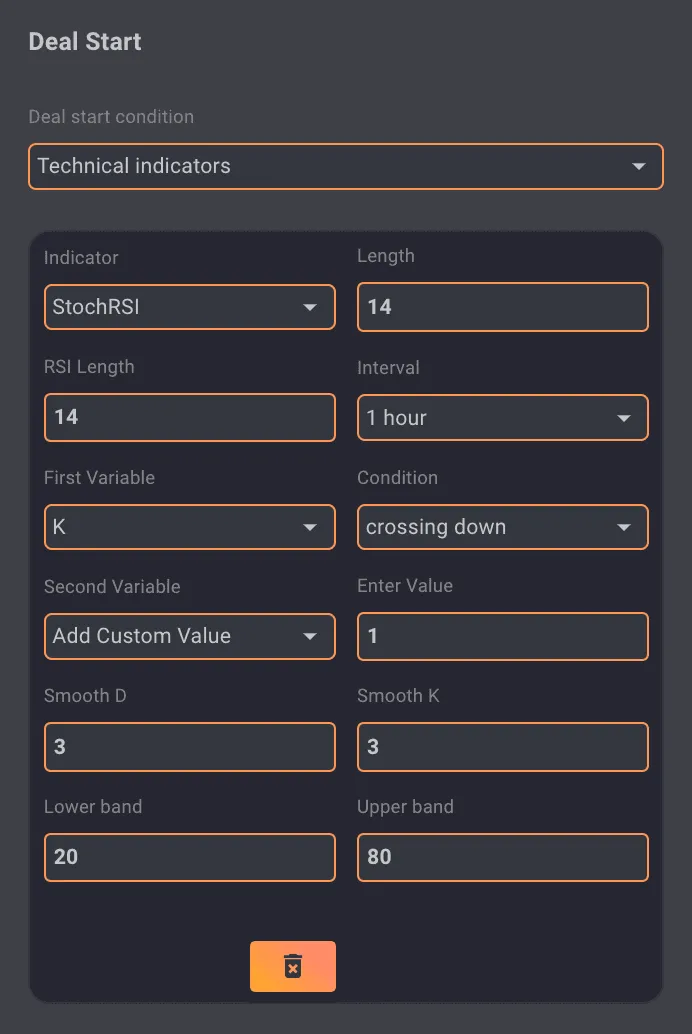 StochRSI
In this indicator, the Rsi is represented by the variable K on the chart and the Stochastic by the variable D, as shown in the image below when you open the “Style” tab within the indicator's settings.
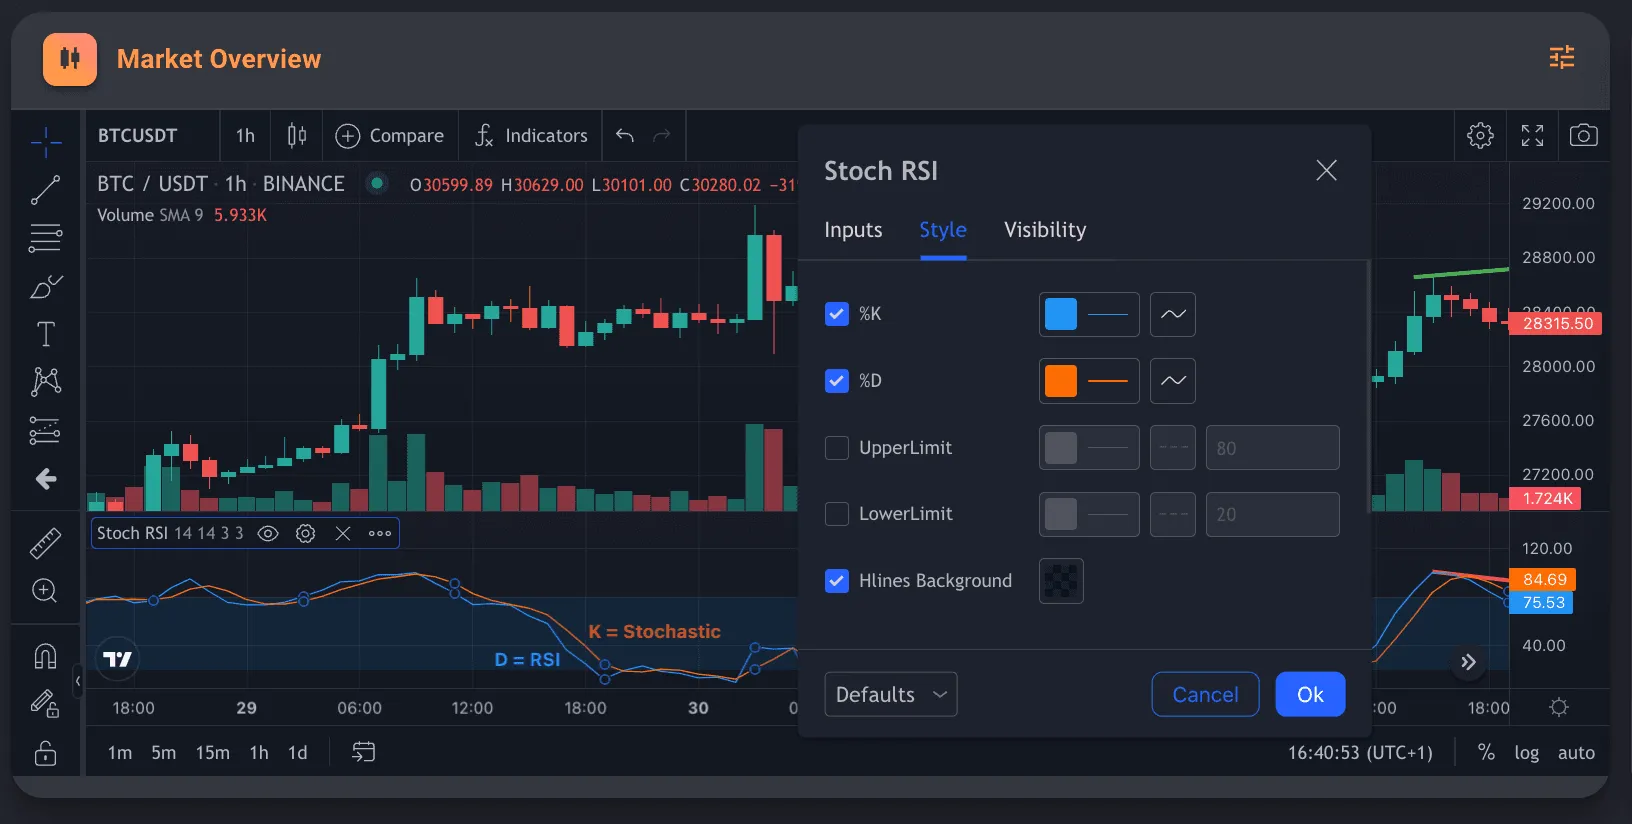 K and D variables
Implementing Stochastic RSI in Your Trading Bot Strategy#
This indicator is very similar to the stochastic oscillator indicator, and it can be used in a very similar way.
Classic Overbought and Oversold#
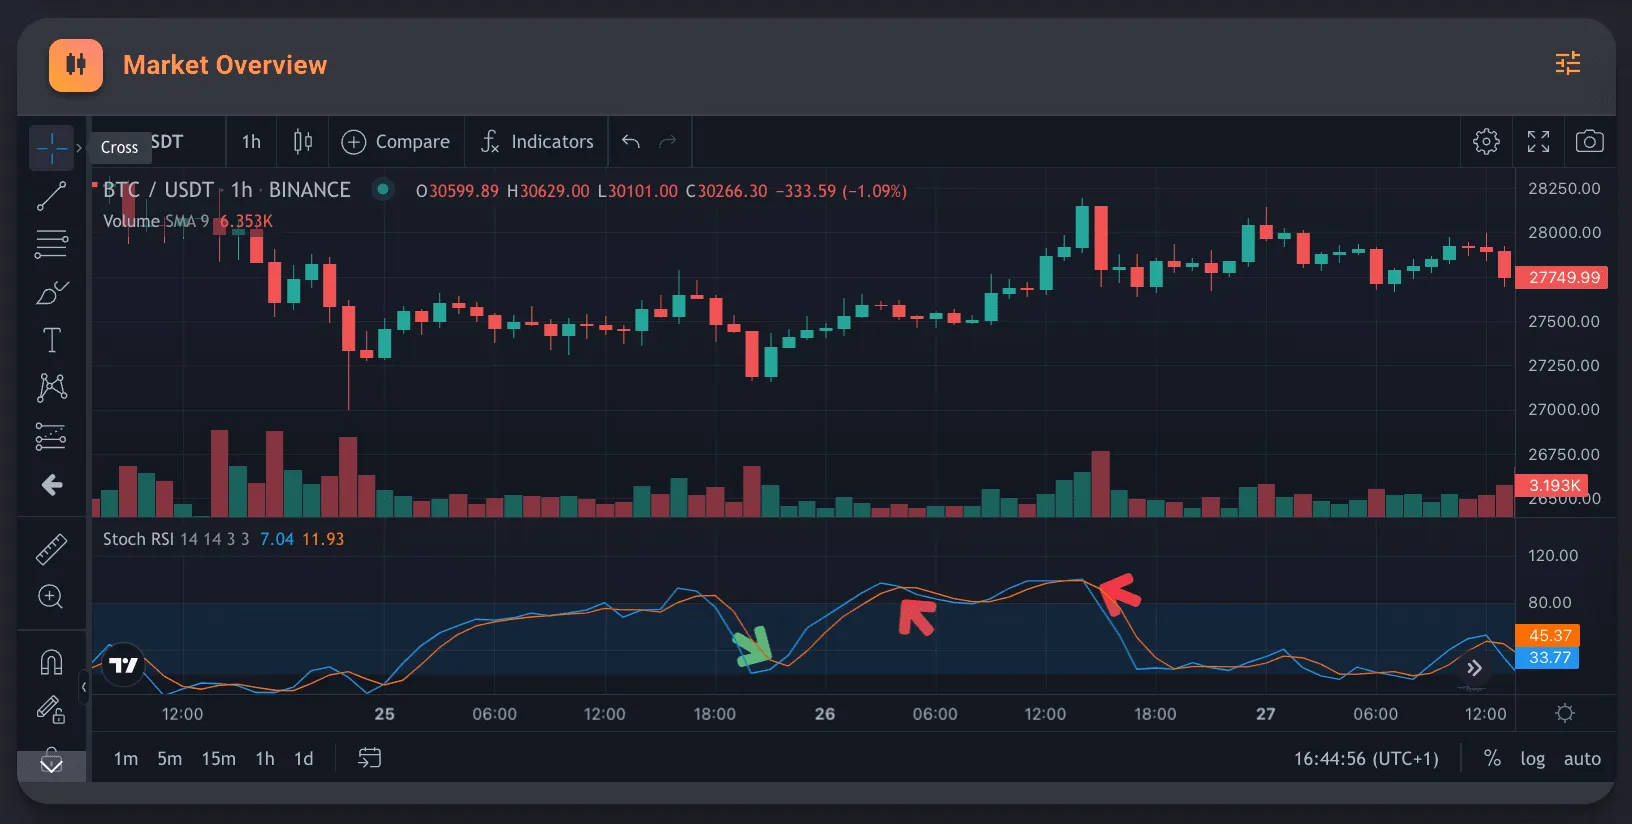
Traders may use the Stochastic RSI to identify overbought and oversold conditions in an asset's price. For example, if the indicator is above 80 (red arrow in the image below), it may indicate that the asset is overbought. If it's below 20 (green arrow in the chart below), it may mean that the asset is oversold. Traders might use these levels to start a bot or take profit, depending on their strategy.
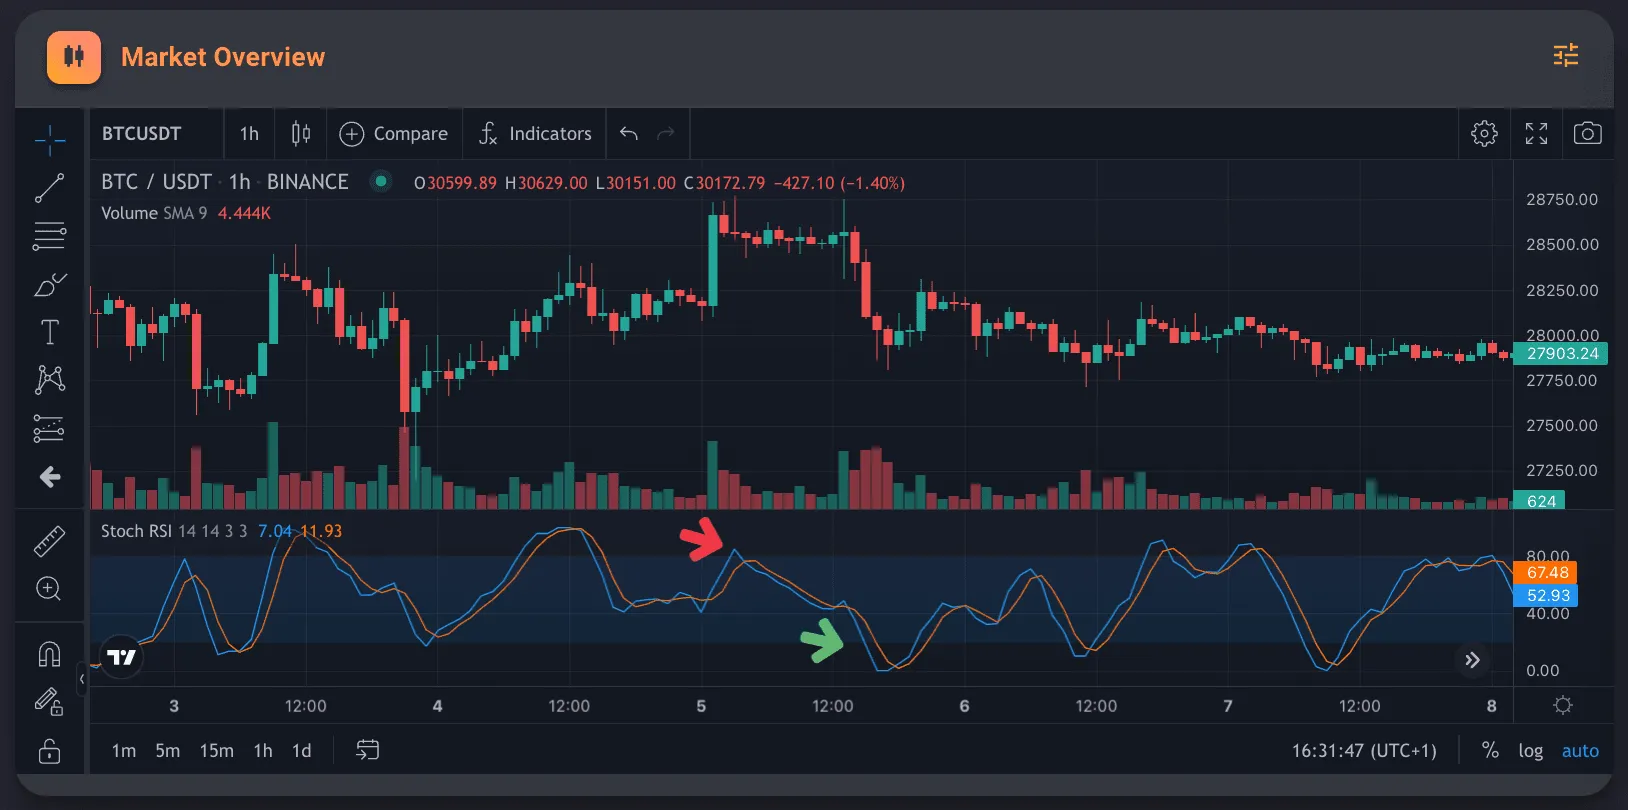 Overbought and Oversold levels
Divergencies#
Traders might also use the Stochastic RSI to identify divergences between the indicator and the asset's price. For example, if the asset's price is making higher highs while the Stochastic RSI is making lower highs, it may suggest that the asset's price is losing momentum and could be due for a reversal. Traders might use this information to enter or exit positions. As you can see in the image below the price decrease not very long after the divergence occurs.
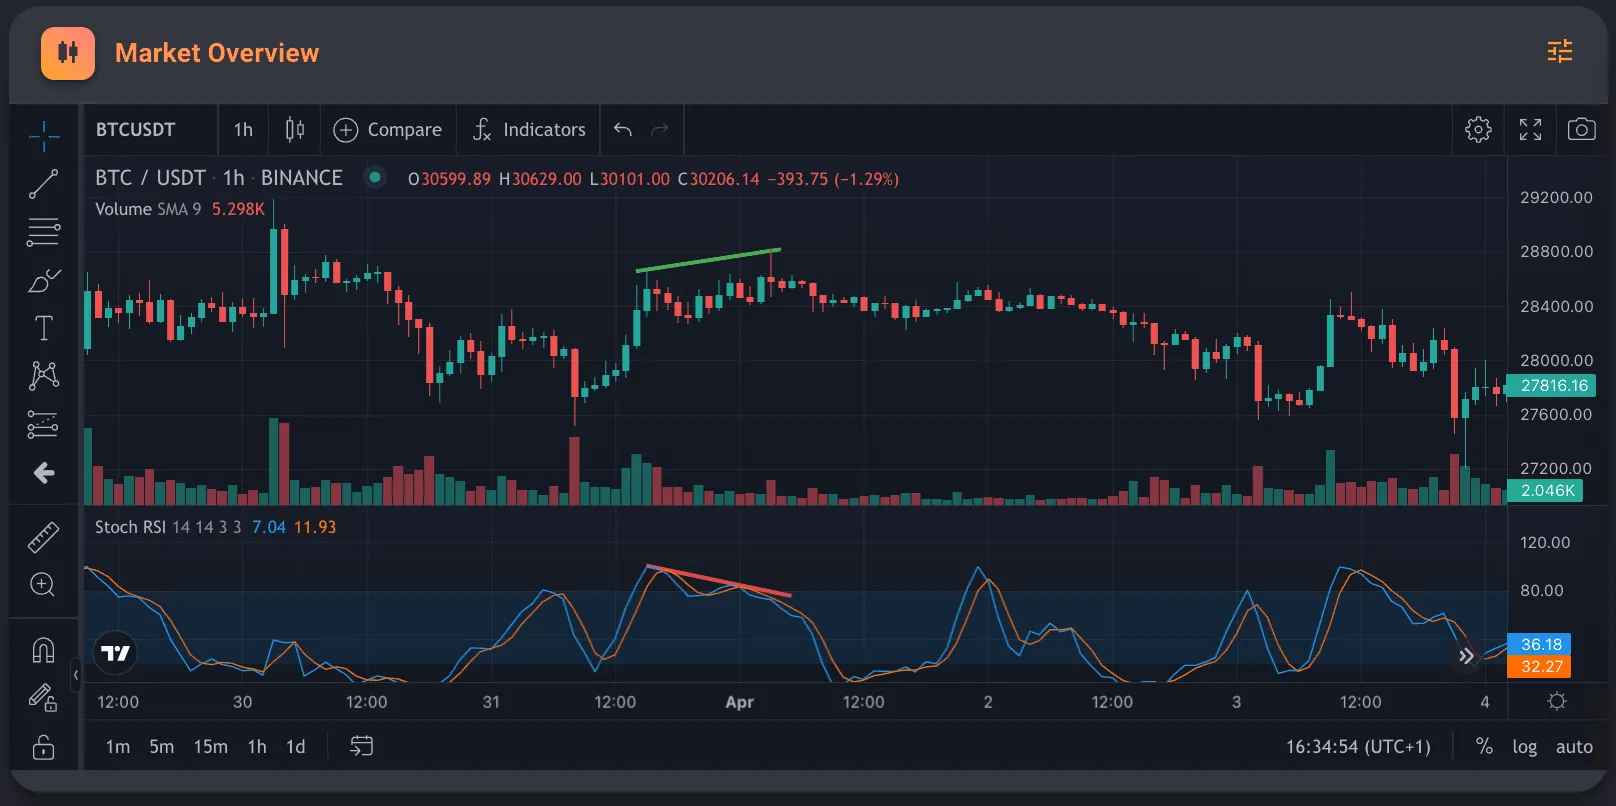 Divergencies
Crossovers#
Traders may also use crossovers of the Stochastic RSI and its signal line to identify potential buy or sell signals. For example, if the RSI (K) crosses above the Stochastic (D), it may indicate a bullish signal, and if it crosses below, it may indicate a bearish signal. Traders might use these crossovers to enter or exit positions. For example, you might want to start a long DCA bot when the K variable is crossing up D or start a short DCA or take profit when the K variable is crossing down D. In the example below, you might even want to use the first cross down for the variable D to sell part of your position or move your stop loss higher as another cross down happens later on at a higher price.
 Crossovers
Conclusion#
The Stochastic RSI indicator is a powerful and adaptable technical tool that can give crypto traders useful information. Combining these tactics with adequate risk management procedures is critical to preserve your portfolio and maximizing profitability.