Average Directional Index (ADX)
In this article, we explain what is the ADX indicator and how it can be used in bot trading.
TL;DR
The Average Directional Index (ADX) measures trend strength on a 0–100 scale without indicating direction; values above 25 suggest a strong trend, below 20 a weak or ranging market. It can be used for trend-following, range trading, divergence, or breakout strategies, and is best combined with directional indicators like RSI.
The cryptocurrency market has seen a surge of interest in trading automation, as traders seek to minimize human error and capitalize on market opportunities more efficiently. One powerful technical indicator that can enhance trading bot performance is the Average Directional Index (ADX). In this article, we'll delve into the effective use of ADX in your automated trading strategy, focusing on the BTC/USDT pair.
Understanding the ADX Technical Indicator#
The ADX, developed by J. Welles Wilder Jr. in 1978, is a momentum-based technical indicator that measures the strength of a trend without considering its direction. The ADX ranges from 0 to 100, with higher values indicating a stronger trend. Typically, a value above 25 suggests a strong trend, while a value below 20 indicates a weak or non-trending market. The ADX is derived from two other Wilder's indicators, the Positive Directional Indicator (+DI) and the Negative Directional Indicator (-DI), which provide insight into the direction of the trend.
| ADX Value | Trend Strength |
|---|---|
| 0-25 | Non-trending market or range-bound market |
| 25-50 | Strong trend |
| 50-75 | Very strong trend |
| 75-100 | Extremely strong trend (rarely happens and can be considered unsustainable) |
Using the ADX indicator in Gainium#
You can select this indicator by selecting “Technical Indicators” from the drop-down menu first then “ADX” in the “Indicator” Section.
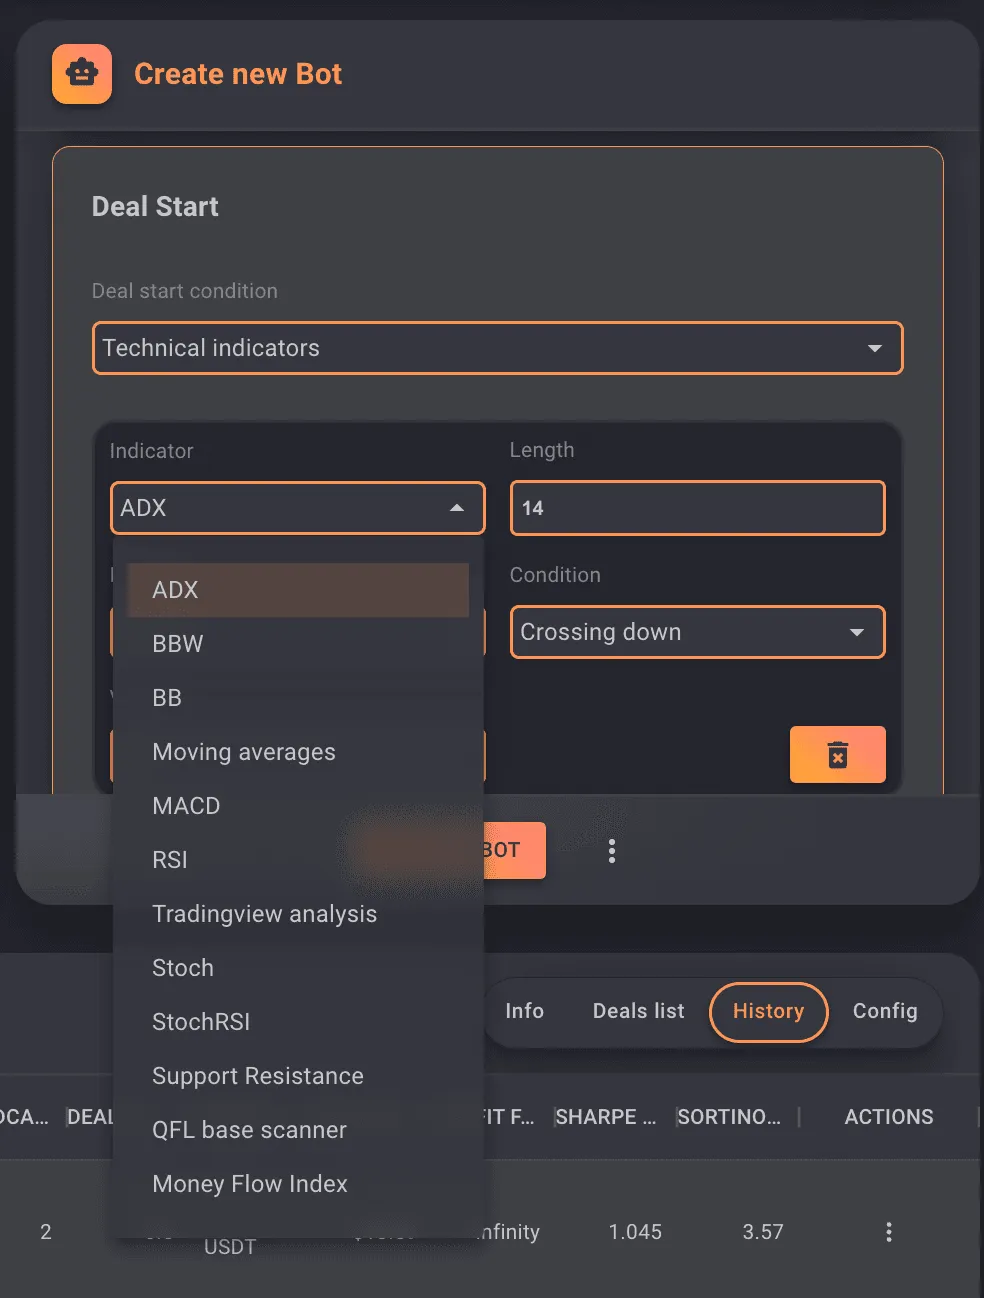 Deal Start
The Adx indicator in Gainium allows you to trade a trending market by selecting the value and the condition. When price action is supported by a crossover of a desired value of ADX, the more likely the move is going to continue in that direction. Meaning that ADX is a very good tool to support a real breakout.
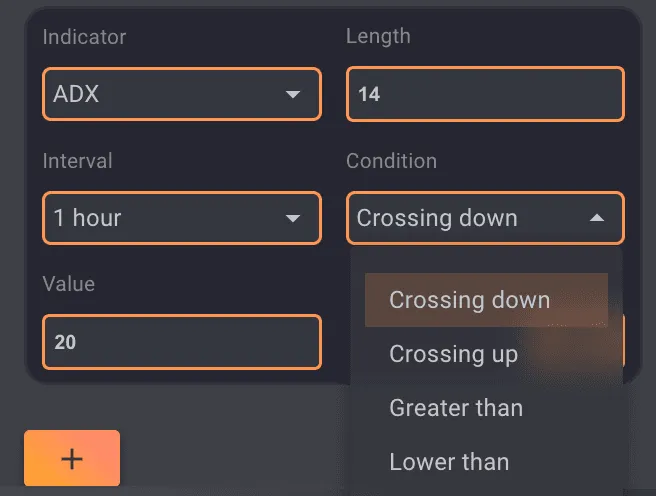 ADX Indicator in Gainium
The most common ADX settings are a 14-period length, a high volatility threshold of 25, and a low volatility threshold of 20. In other words, a market is considered volatile when the ADX is greater than 25, and calm when it is less than 20.
Using ADX indicator in bot trading#
Here are a few examples of how you can incorporate ADX in your bot strategy.
A. ADX Trend Following Strategy#
In a trend-following strategy, your trading bot will enter a long position when the ADX value is above 25. This is an excellent time to enter a trade in the direction of the trend. For example, if the ADX is rising and above 30 while the asset is increasing in price, it could signal a good time to enter a long position (buy).
In the image below, you can see the price action in the chart BTC USDT when ADH is higher than 30, and the price keeps rising in the same direction.
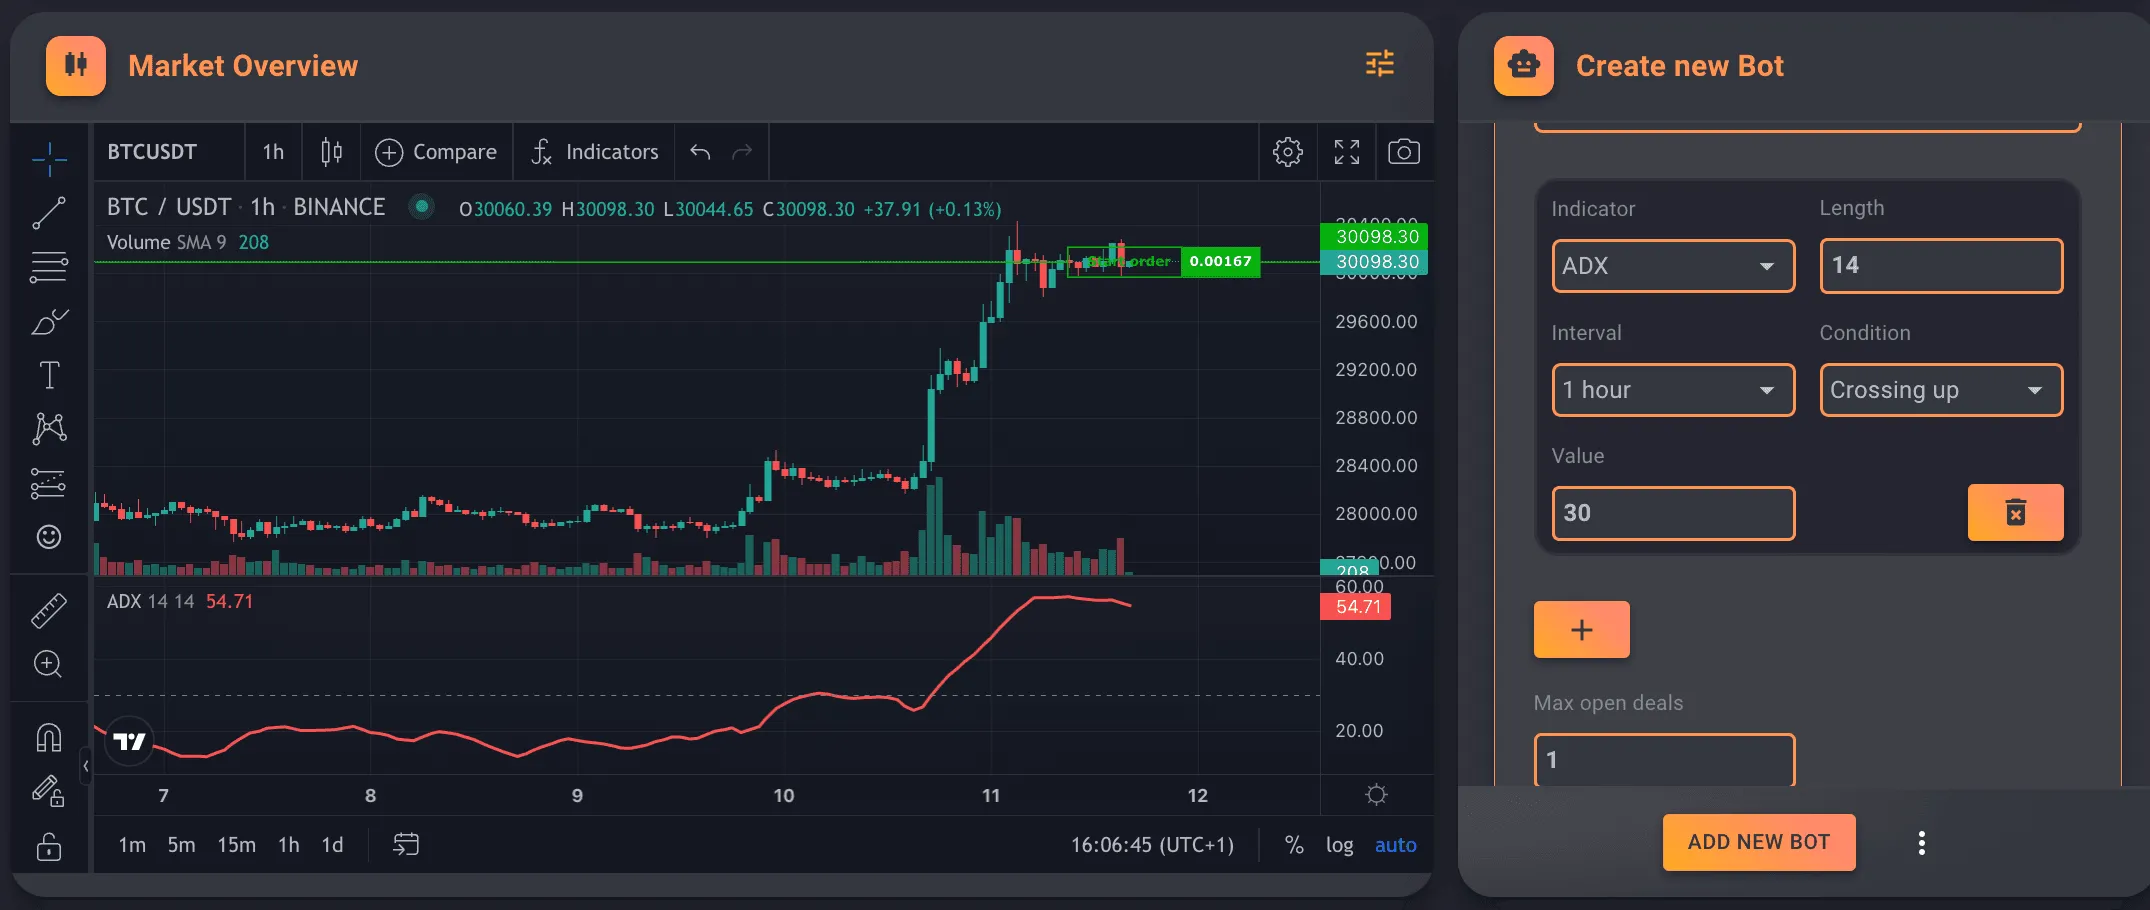 ADX Crossing up 30
B. ADX Range Trading Strategy#
In a range trading strategy, your bot will capitalize on the lack of a strong trend by buying low and selling high within a specified price range. Your bot can implement range trading tactics if the ADX value falls below 20, indicating a weak or non-trending market. Combining the ADX with other range-bound indicators, such as Bollinger Bands or Stochastic Oscillator, or stoch RSI, can further improve the accuracy of buy and sell signals.
For instance, when the ADX for the BTC/USDT pair drops below 20 and the price reaches the lower Bollinger Band, the bot can initiate a long position, anticipating an upward price movement. Conversely, the bot can exit the position or create a short trade when the price reaches the upper Bollinger Band.
C. ADX Divergence Trading Strategy#
If the ADX is trending downward while the asset's price is trending upward, this is a divergence and could signal that the trend is weakening. It may be an excellent time to consider exiting the trade or taking profits. In the image below, the price is rising while ADX is decreasing.
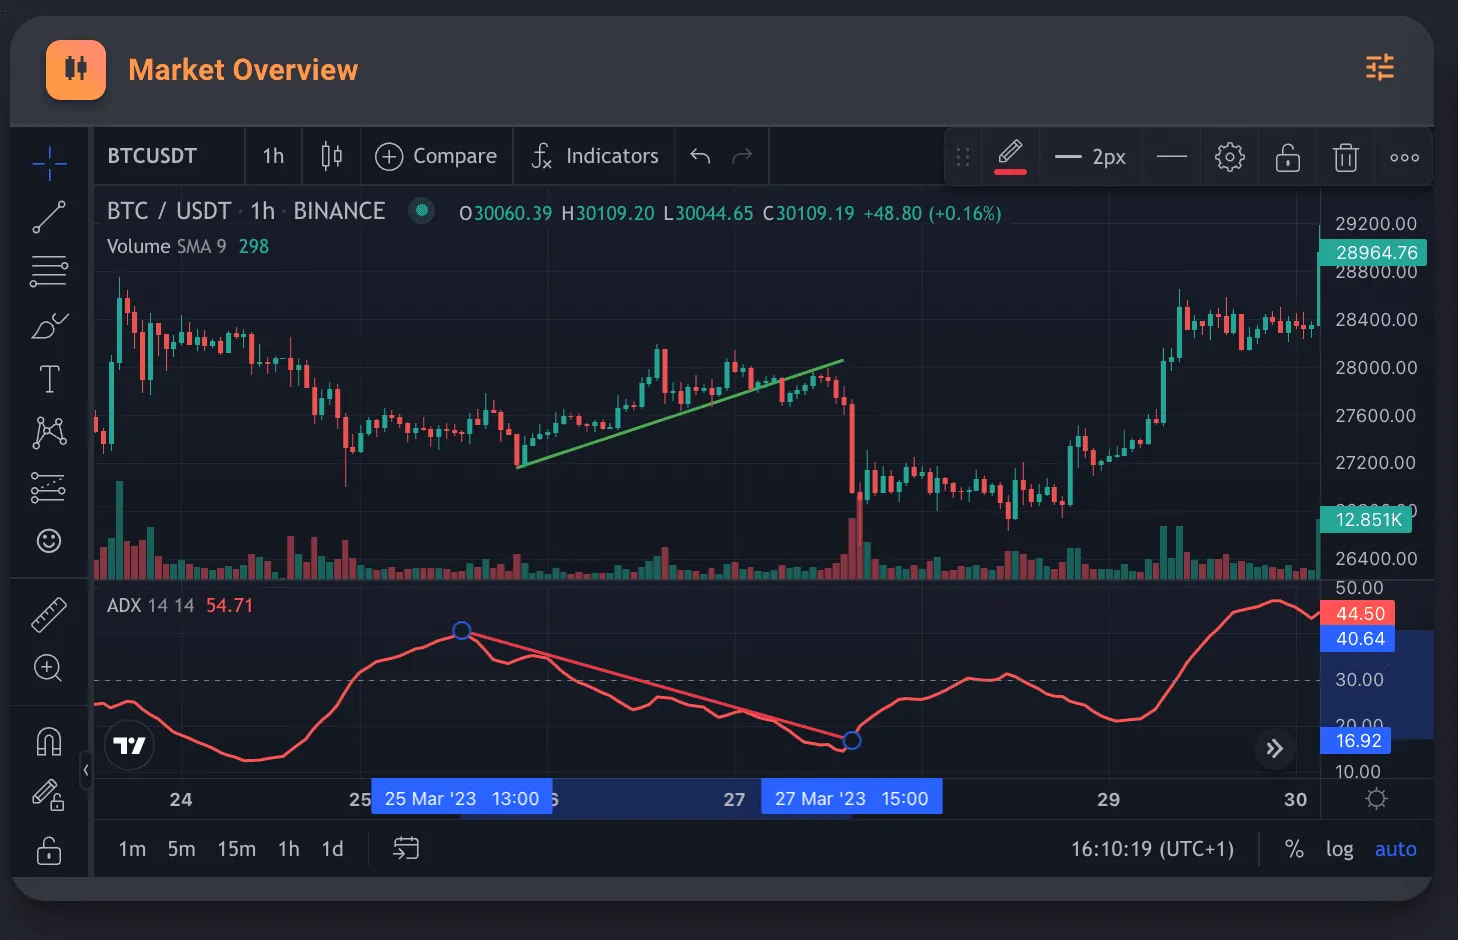 Divergence
D. ADX Breakout Strategy#
The breakout strategy aims to capitalize on significant price movements that follow periods of consolidation. When the ADX value rises from below 20 to above 25, it can signal a potential breakout.
Practical considerations when trading with ADX#
As mentioned before, ADX's weakness is that it cannot determine the direction of a trend, so it is not always beneficial by itself. It is often combined with other indicators, for example, with RSI. A buy signal could be placed when RSI rises and ADX rises and crosses up 30. In the example below, both RSI and the Volume indicators support the long entry as the price increases. You then can decide to take profit when RSI and /or volume start to decline.
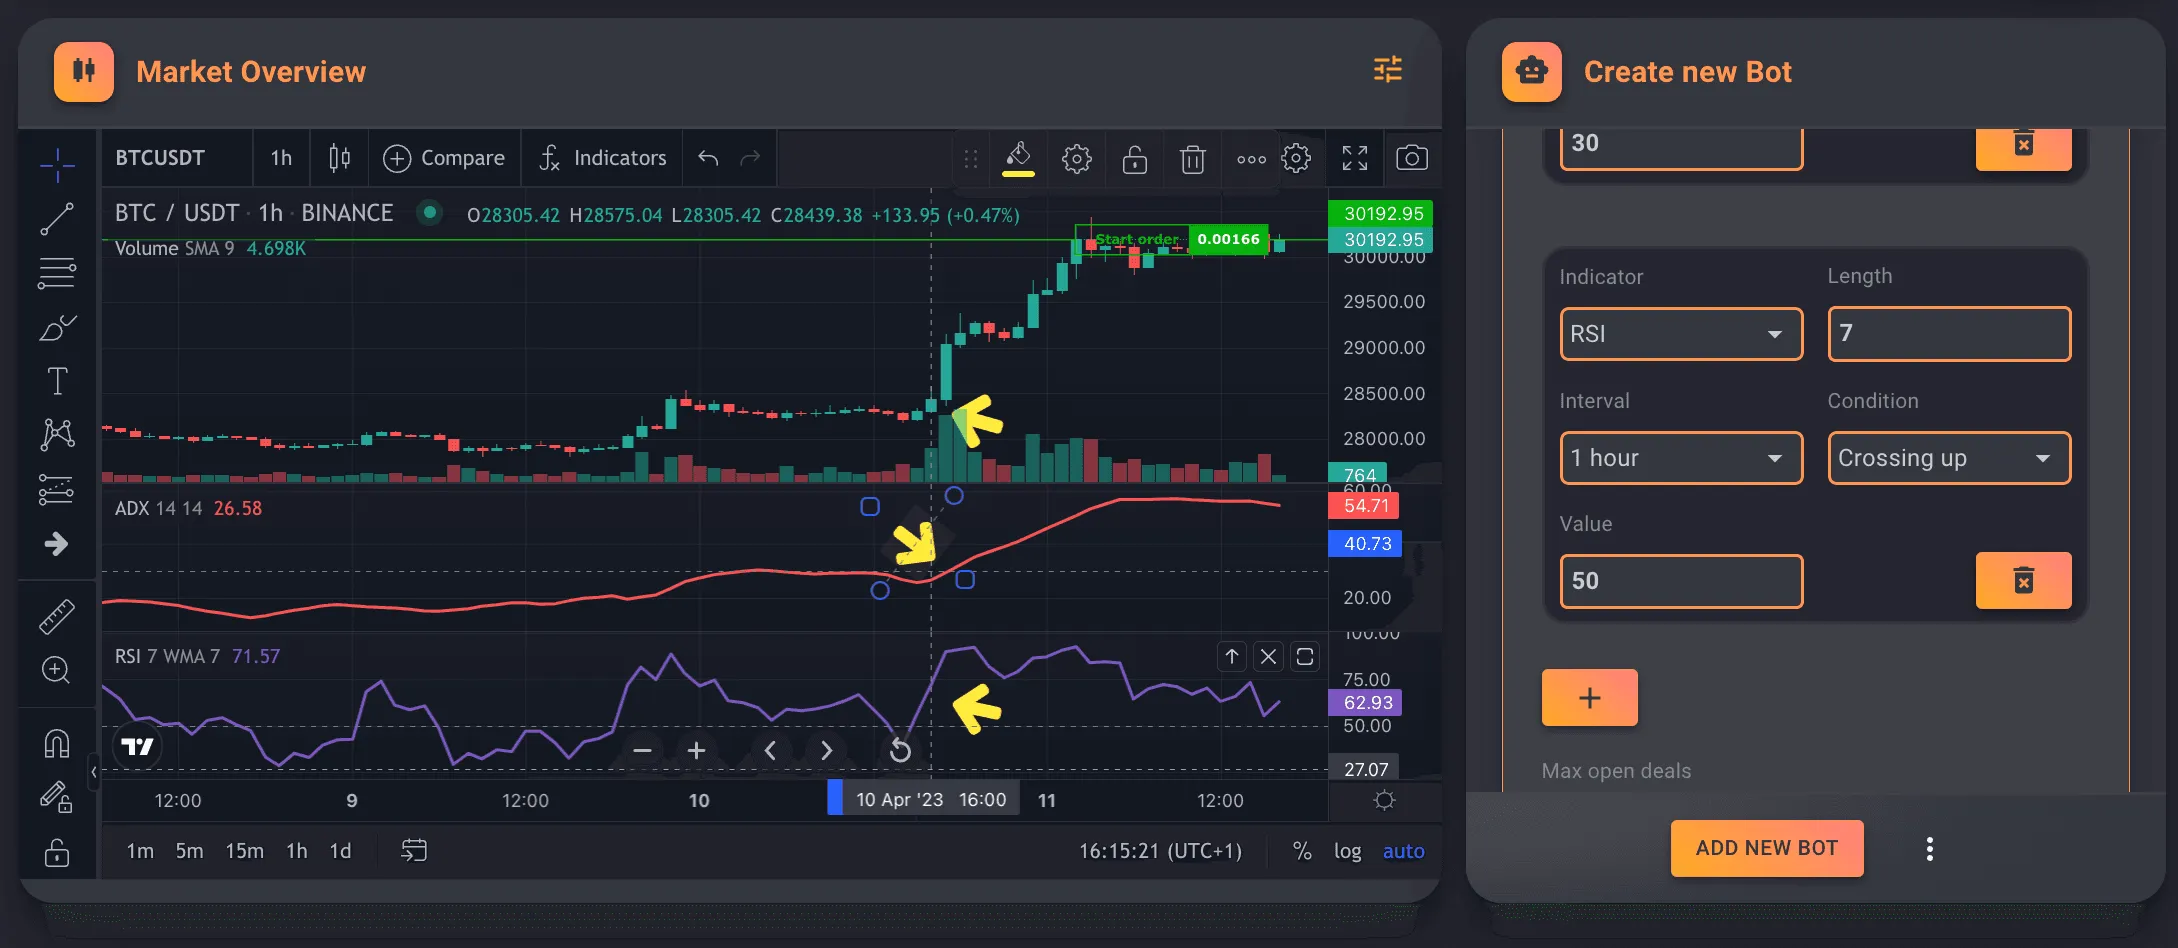 ADX with RSI and Volume
Conclusion#
The ADX indicator can be valuable for assessing trend strength and informing your crypto trading bot's decision-making process. As with any trading strategy, testing and refining the parameters to suit your risk tolerance and the prevailing market conditions is crucial. Incorporating the ADX with additional technical indicators and fundamental analysis can help create a more robust and well-rounded trading bot strategy.